SDA Operator’s Manual
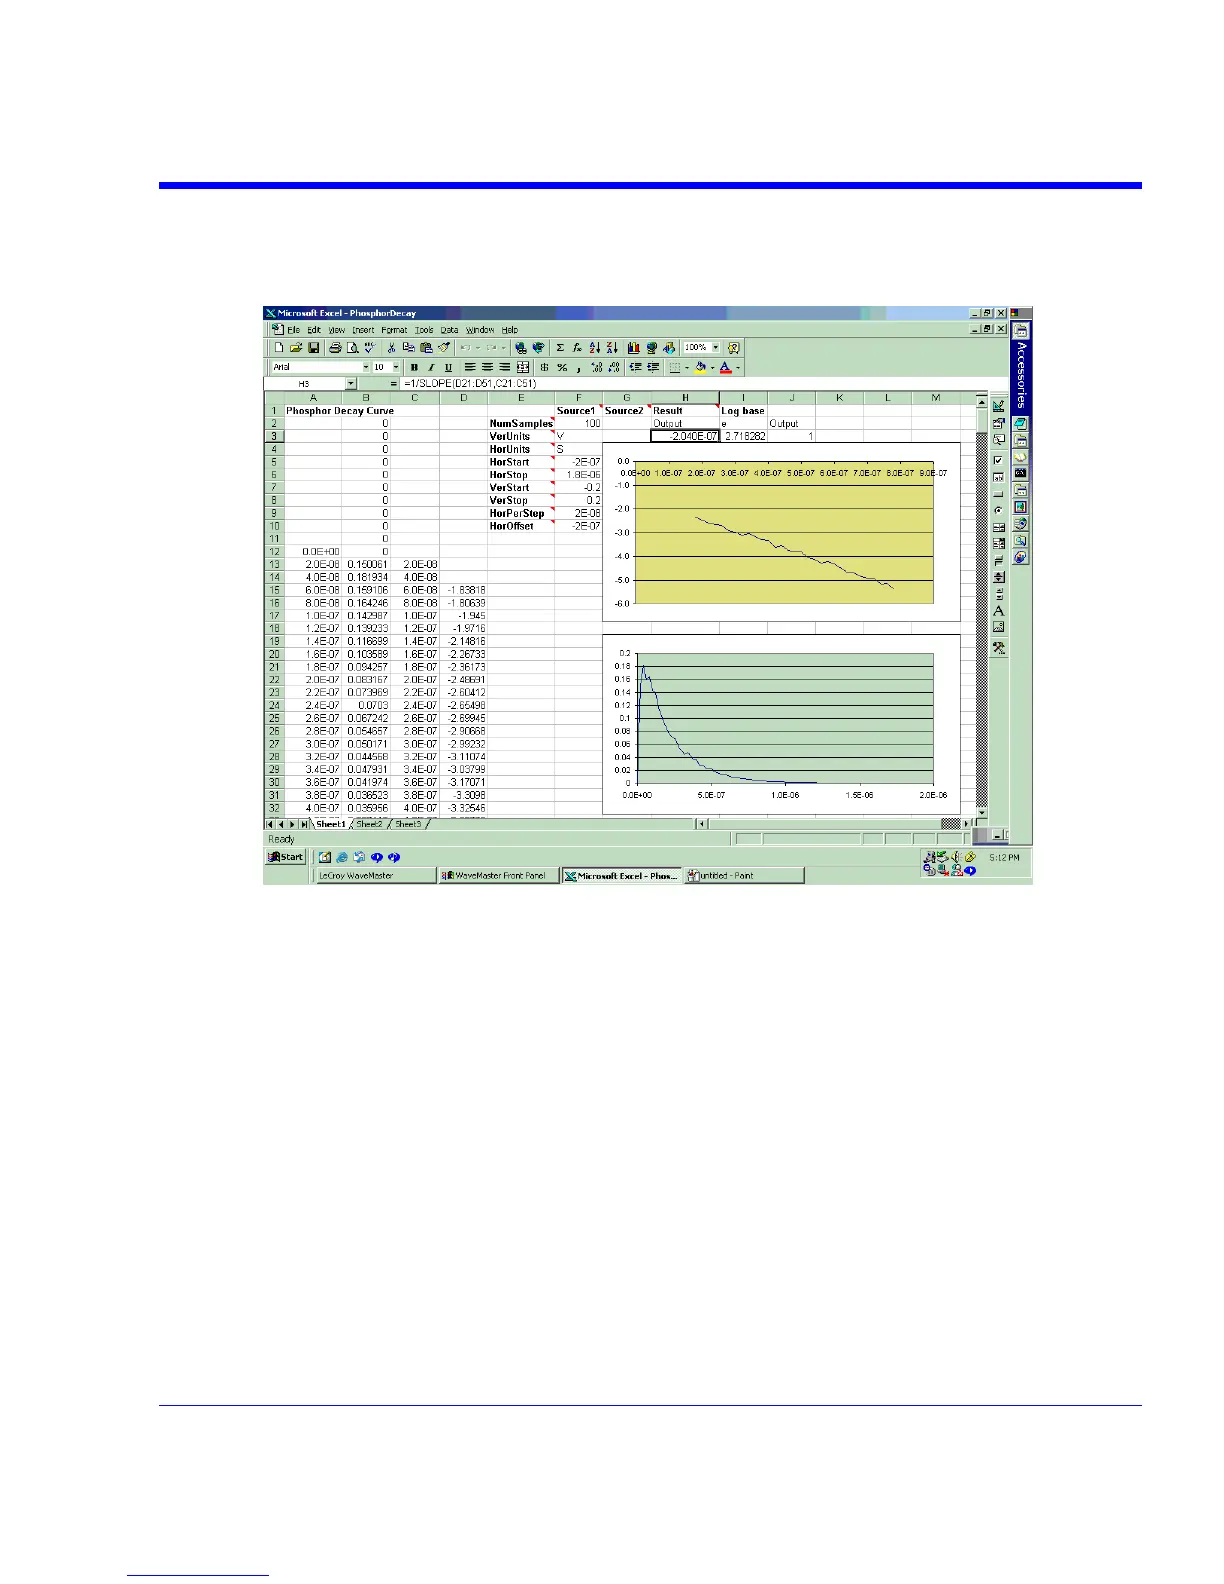
For the actual measurement, Parameter P1 was set up as an Excel call. In Excel, the selected
portion of the trace was converted to logarithms, and the Excel function SLOPE was used, as
shown here:
.
Here we see the input data in column B (with a time scale in A) created using the contents of cell
F9, Horizontal Per Step. The logarithmic data are in column D, with the time scale repeated in C.
The output appears in cell H3, using the formula =1/SLOPE(D21:D51,C21:C51).
Excel Example 2: Gated Parameter Using Excel
This example calculates a parameter of a waveform, in a region of interest defined by the leading
edges of two pulses in a separate waveform.
SDA-OM-E Rev H 239