SDA Operator’s Manual
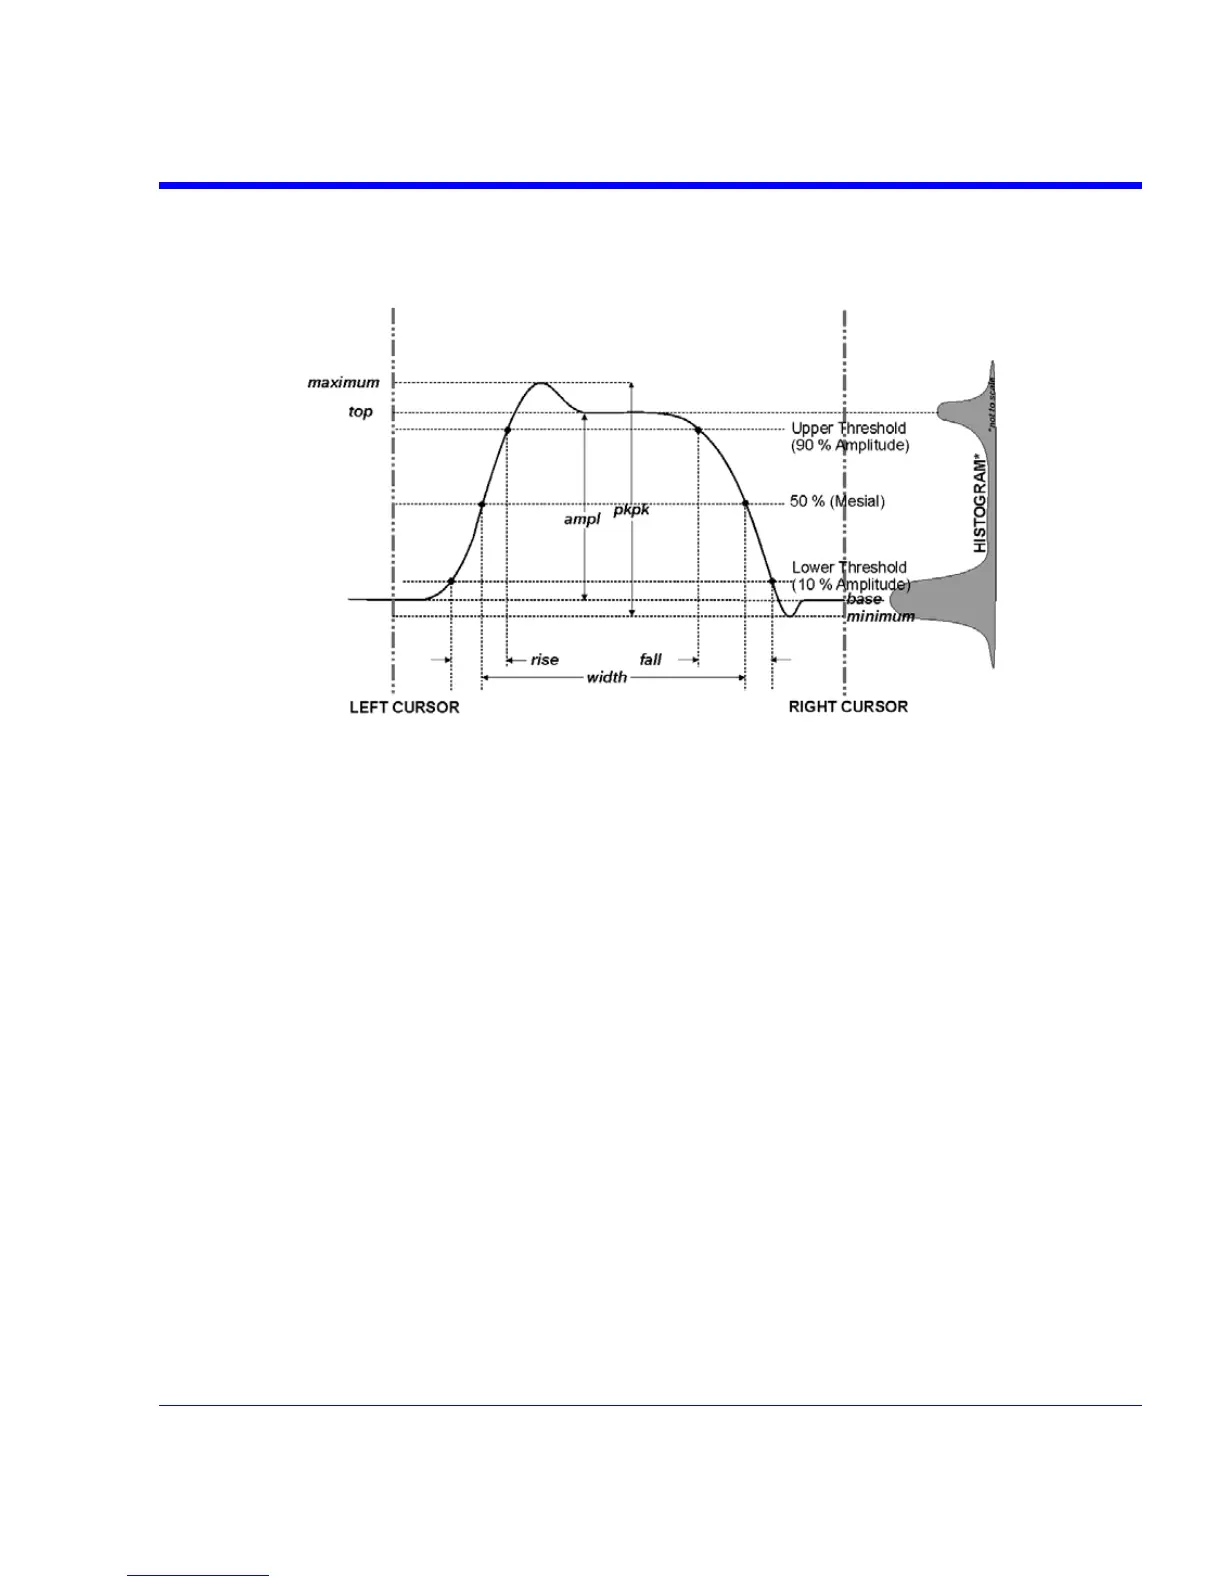
The analysis attempts to identify the two clusters containing the largest data density. Then, the
most probable state (centroids) associated with these two clusters is computed to determine the
top and base reference levels: the top line corresponds to the top and the base line to the bottom
centroid.
Figure 1
Determining Rise and Fall Times
Once top and base are estimated, calculation of the rise and fall times is easily done (see
previous figure). The 90% and 10% threshold levels are automatically determined by the
instrument, using the amplitude (ampl) parameter.
Threshold levels for rise or fall time can also be selected using absolute or relative settings
(r@level, f@level). If absolute settings are chosen, the rise or fall time is measured as the time
interval separating the two crossing points on a rising or falling edge. But when relative settings
are chosen, the vertical interval spanned between the base and top lines is subdivided into a
percentile scale (base = 0 %, top = 100 %) to determine the vertical position of the crossing
points.
SDA-OM-E Rev H 151