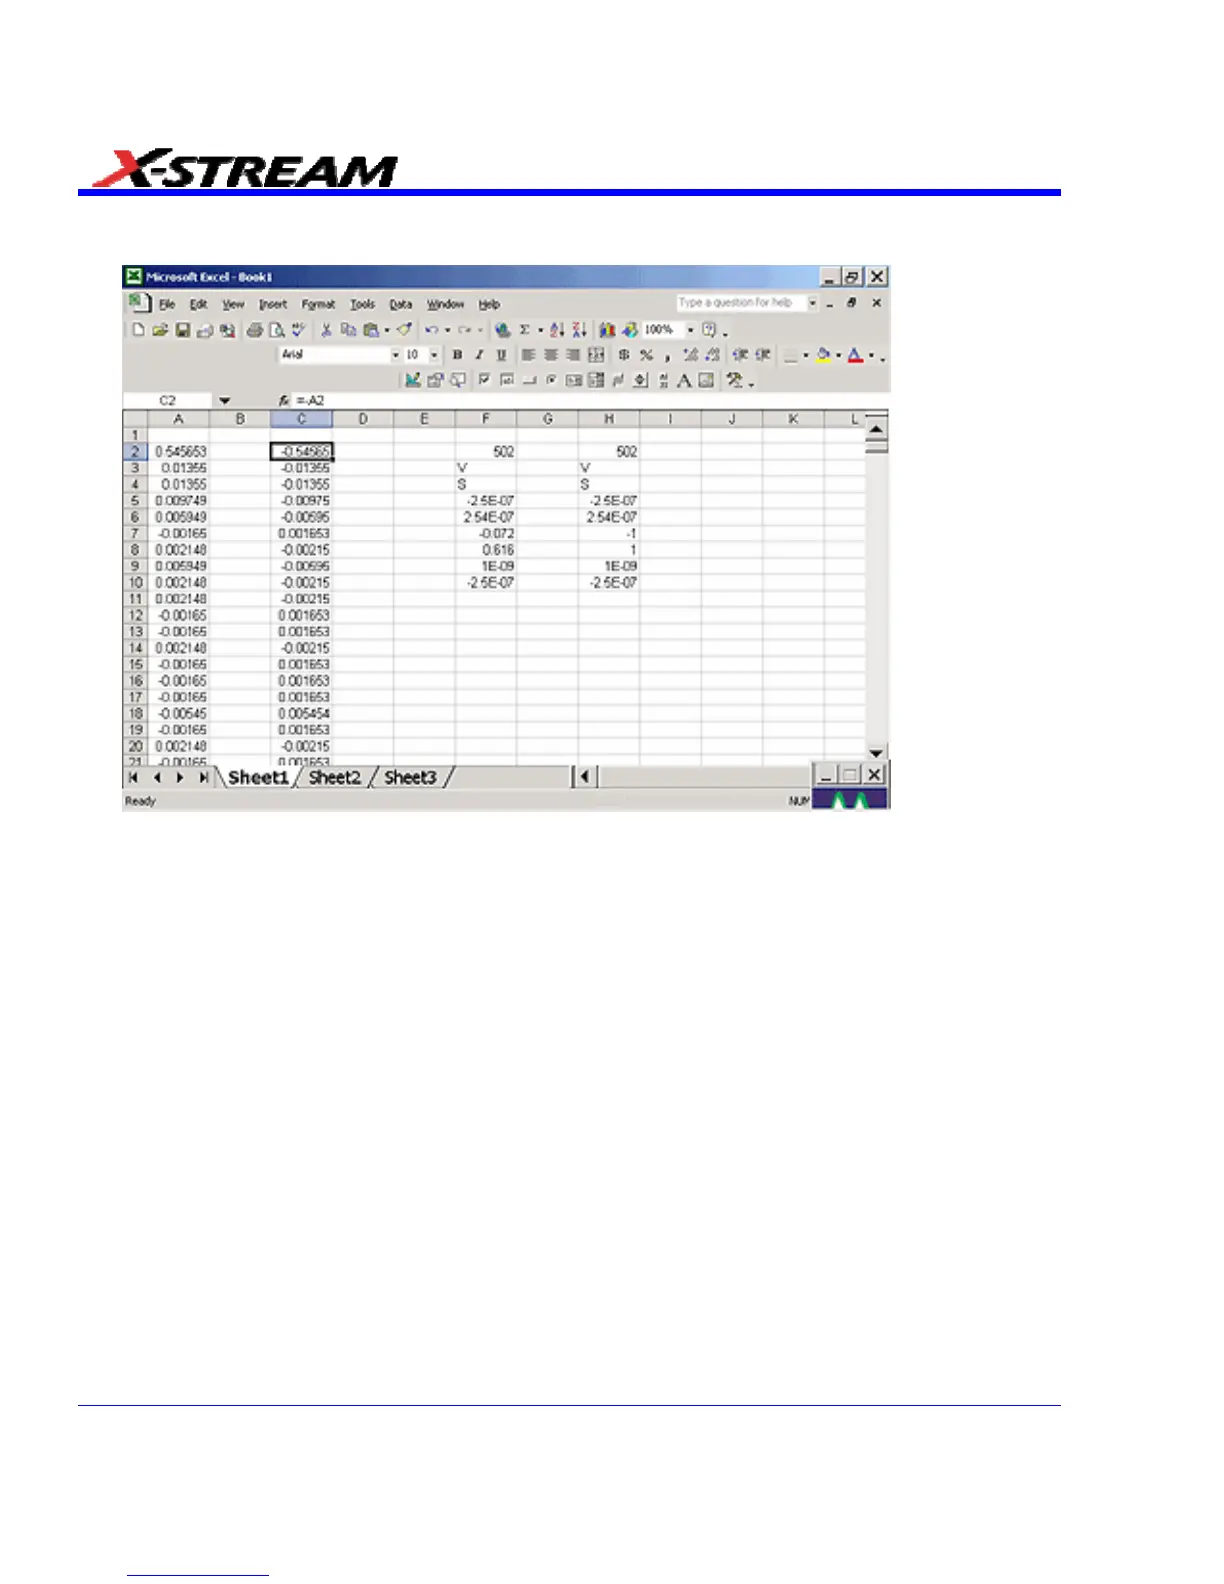
4. Create your formula for each data point in column A (in this case, our formula for cell C2 is –
A2, copied for the entire column), as shown here:
.
5. Retrigger the scope (if it is not currently triggering)
6. Return to the program
Note that the only action that was needed in Excel was to create the formula in column C for
each data point in column A. The instrument automatically opens Excel, puts the waveform
data in the correct columns, and returns the calculated data back to the display as the chosen
F trace. This Excel-calculated trace can have further measurements or math calculations
performed on it, if desired.
236 SDA-OM-E Rev H