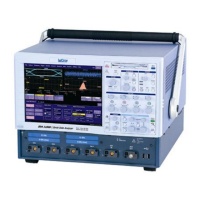
Figure 11: The measured histogram of TIE values is extrapolated by fitting curves to the
bins below the 10th and above the 90th percentile. The log of the histogram is used to
simplify this process to a quadratic fit.
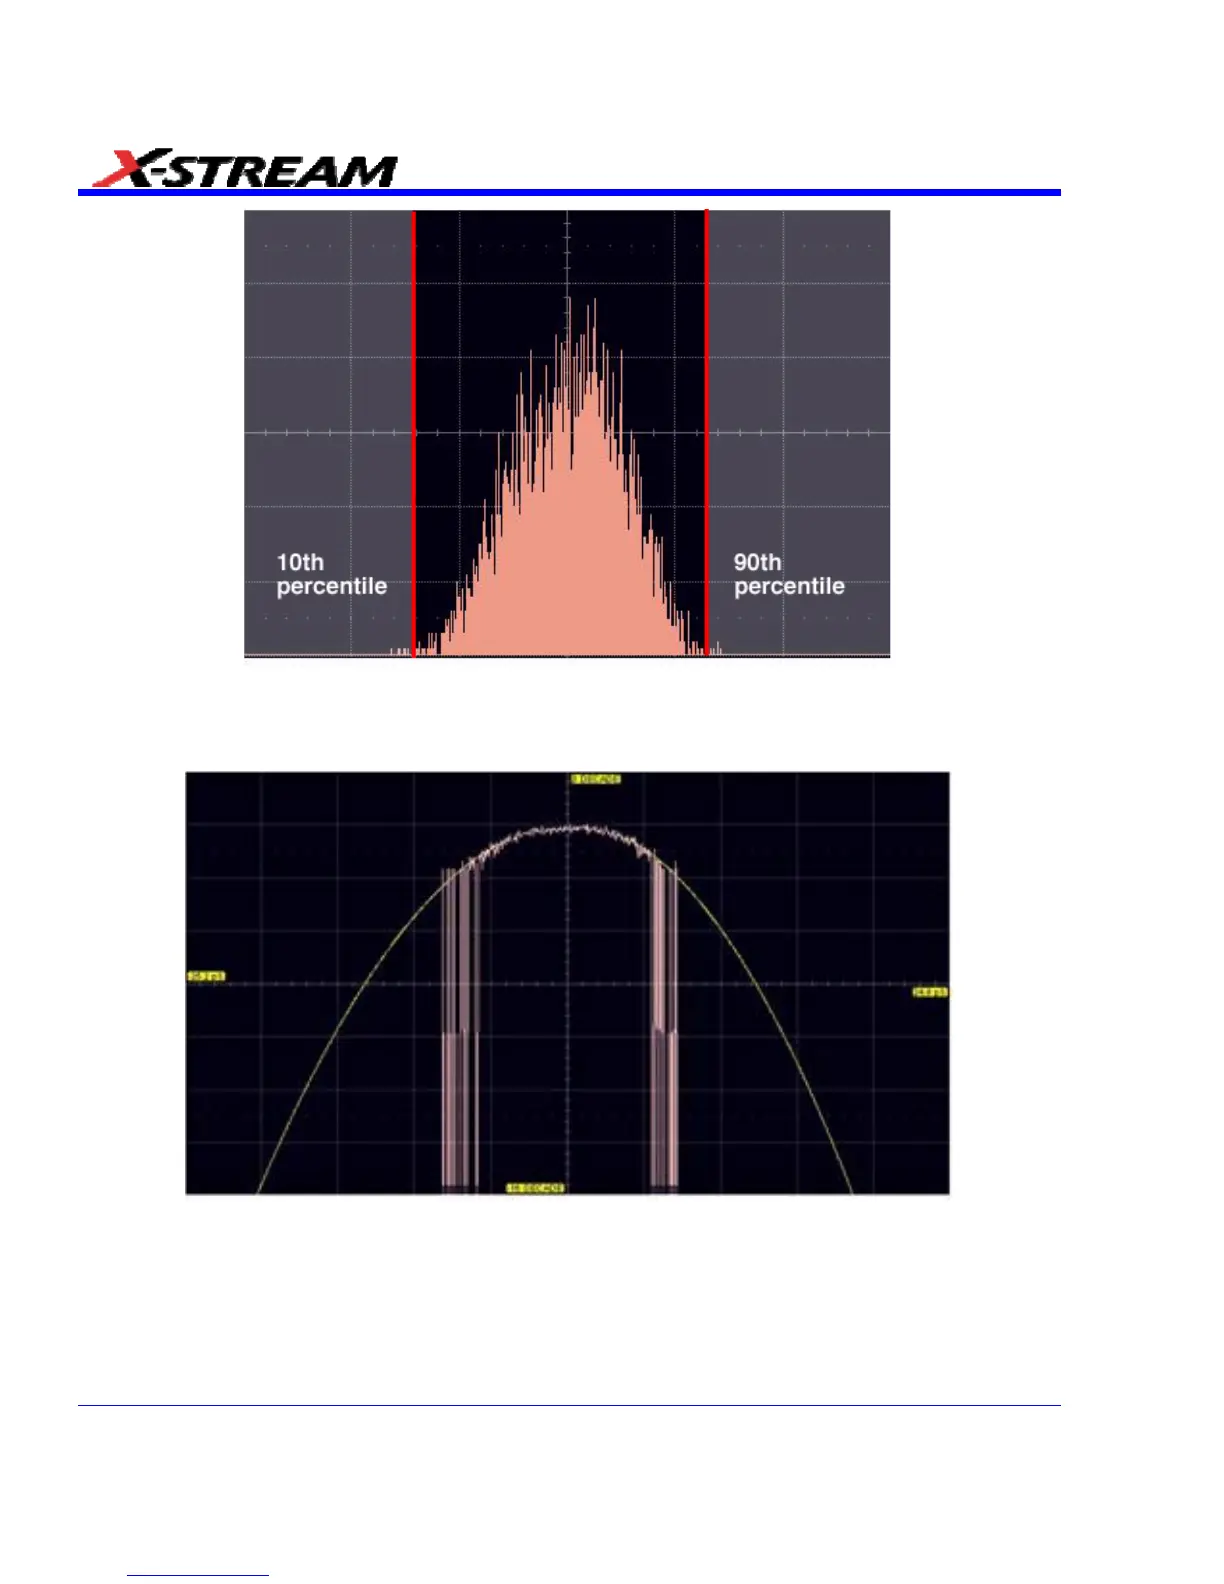
Figure 12: Logarithm of the measured TIE histogram superimposed on the extrapolated curve (in
yellow). The extrapolation uses a quadratic curve fit to the histogram bins at the extremes.
378 SDA-OM-E Rev H