Introduction History Dialogs
21 - 2 V Series Operating Instructions
21.1 Introduction
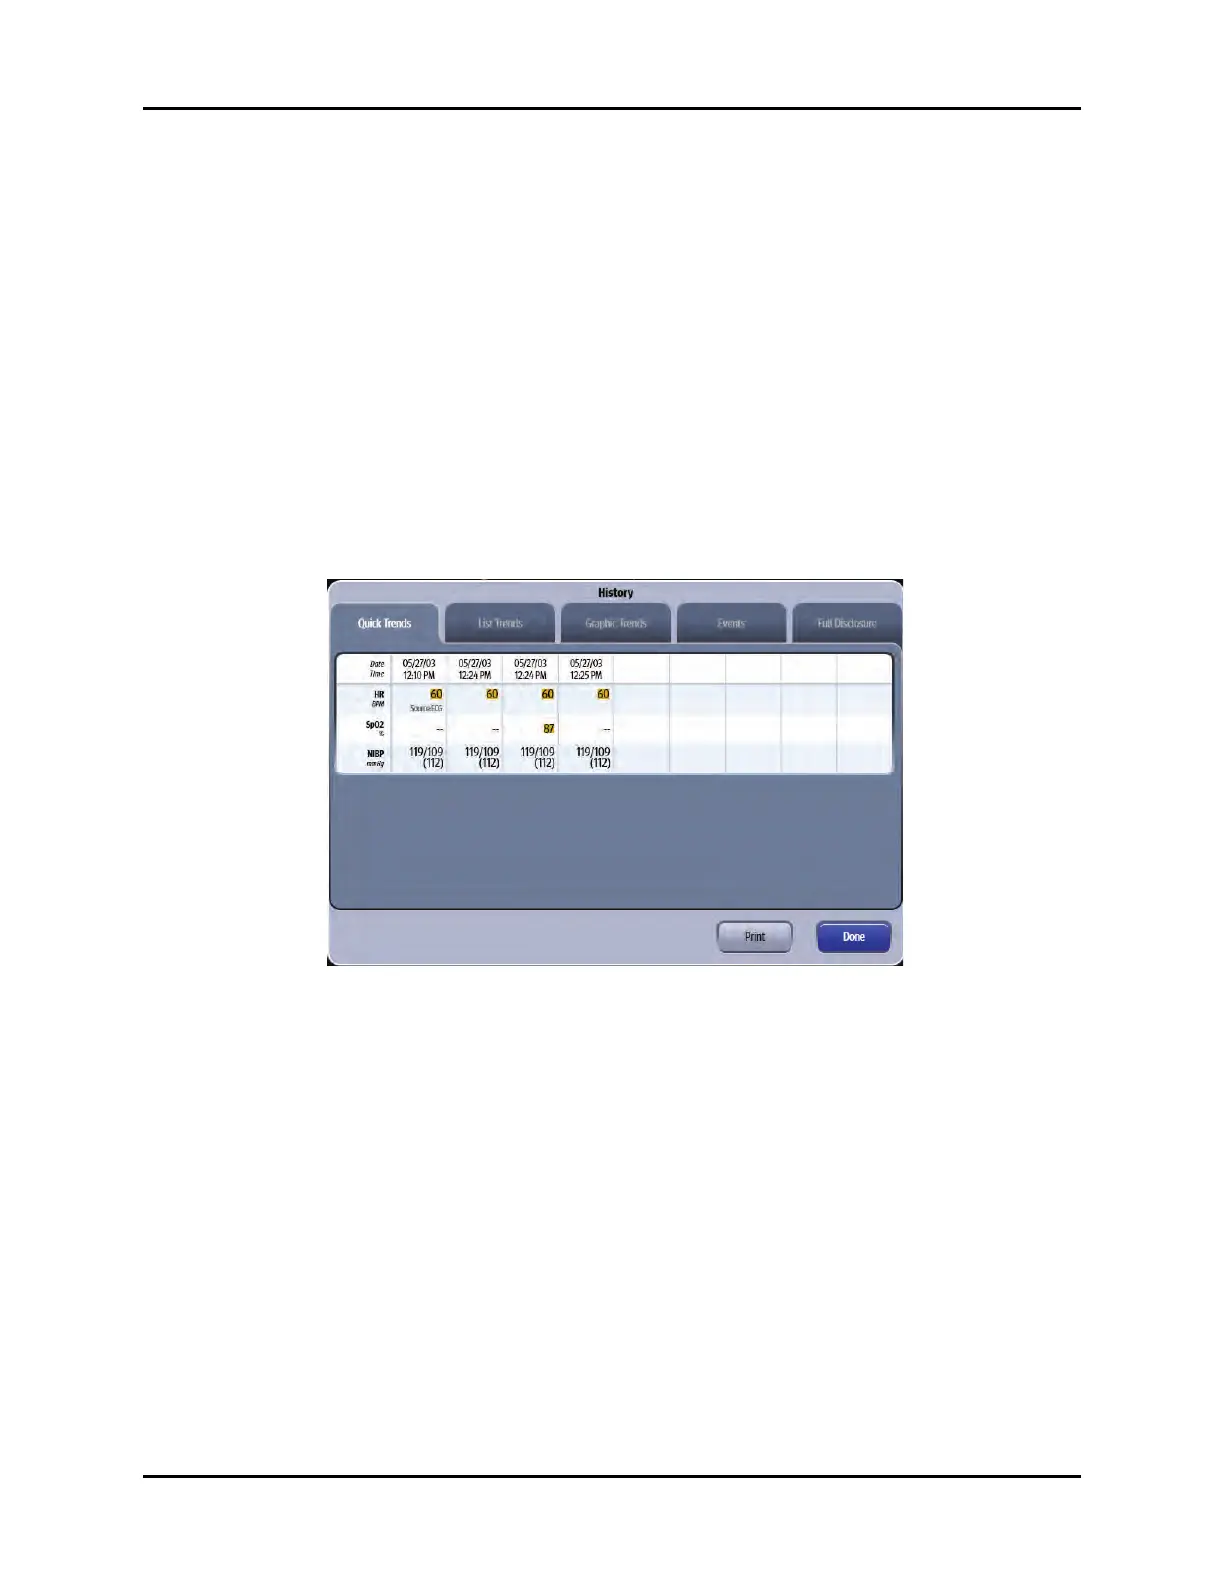
The History dialog provides access to a patient’s historical physiological data. The History dialog (as
shown in FIGURE 21-1) contains a Quick Trends tab, List Trends tab, Graphic Trends tab, Events,
and Full Disclosure tab. A description of each tab follows.
Patient Sizes
Intended patient types: Adult, Pediatric, Neonate.
21.2 Trends
The History dialog contains Quick Trends, List Trends, and Graphic Trends.
21.2.1 Navigating to the Quick Trends Tab
• Select the History button from the Navigation Area.
The History dialog displays (as shown in FIGURE 21-1) with the Quick Trends tab selected.
FIGURE 21-1 Example History Dialog (Quick Trends Tab)
21.2.2 About Quick Trends
The Quick Trends tab allows the user to view an abbreviated tabular listing of HR, SpO
2
and NIBP data
only and includes the date and time the trend recorded. Data will not collect in the Quick Trends list
until an NIBP measurement is taken. Each time an NIBP measurement is taken, the list updates. The
list can only display a maximum of nine (9) records at one time. Once the tenth NIBP measurement is
taken, the first measurement is removed from the Quick Trends list but not from the List Trends list.
21.2.3 List Trends
The List Trends display allows the user to view a tabular list of stored patient vital signs. Trend data
automatically displays in one minute intervals unless an alternate Trend Display interval is selected.
NOTE: Refer to "Configuring a Display Interval" on page 21-15 for additional
information.
Selecting the List Trends tab before the first measurement is taken will display an empty list. An NIBP,
CO/CI, or PAWP measurement must be taken before the list will populate. All previously collected
parameter data displays, even if the parameter is not currently being monitored.