V Series Operating Instructions 21 - 5
History Dialogs Trends
21.2.12 Navigating to the Graphic Trends Tab
1. Select the History button from the Navigation Area.
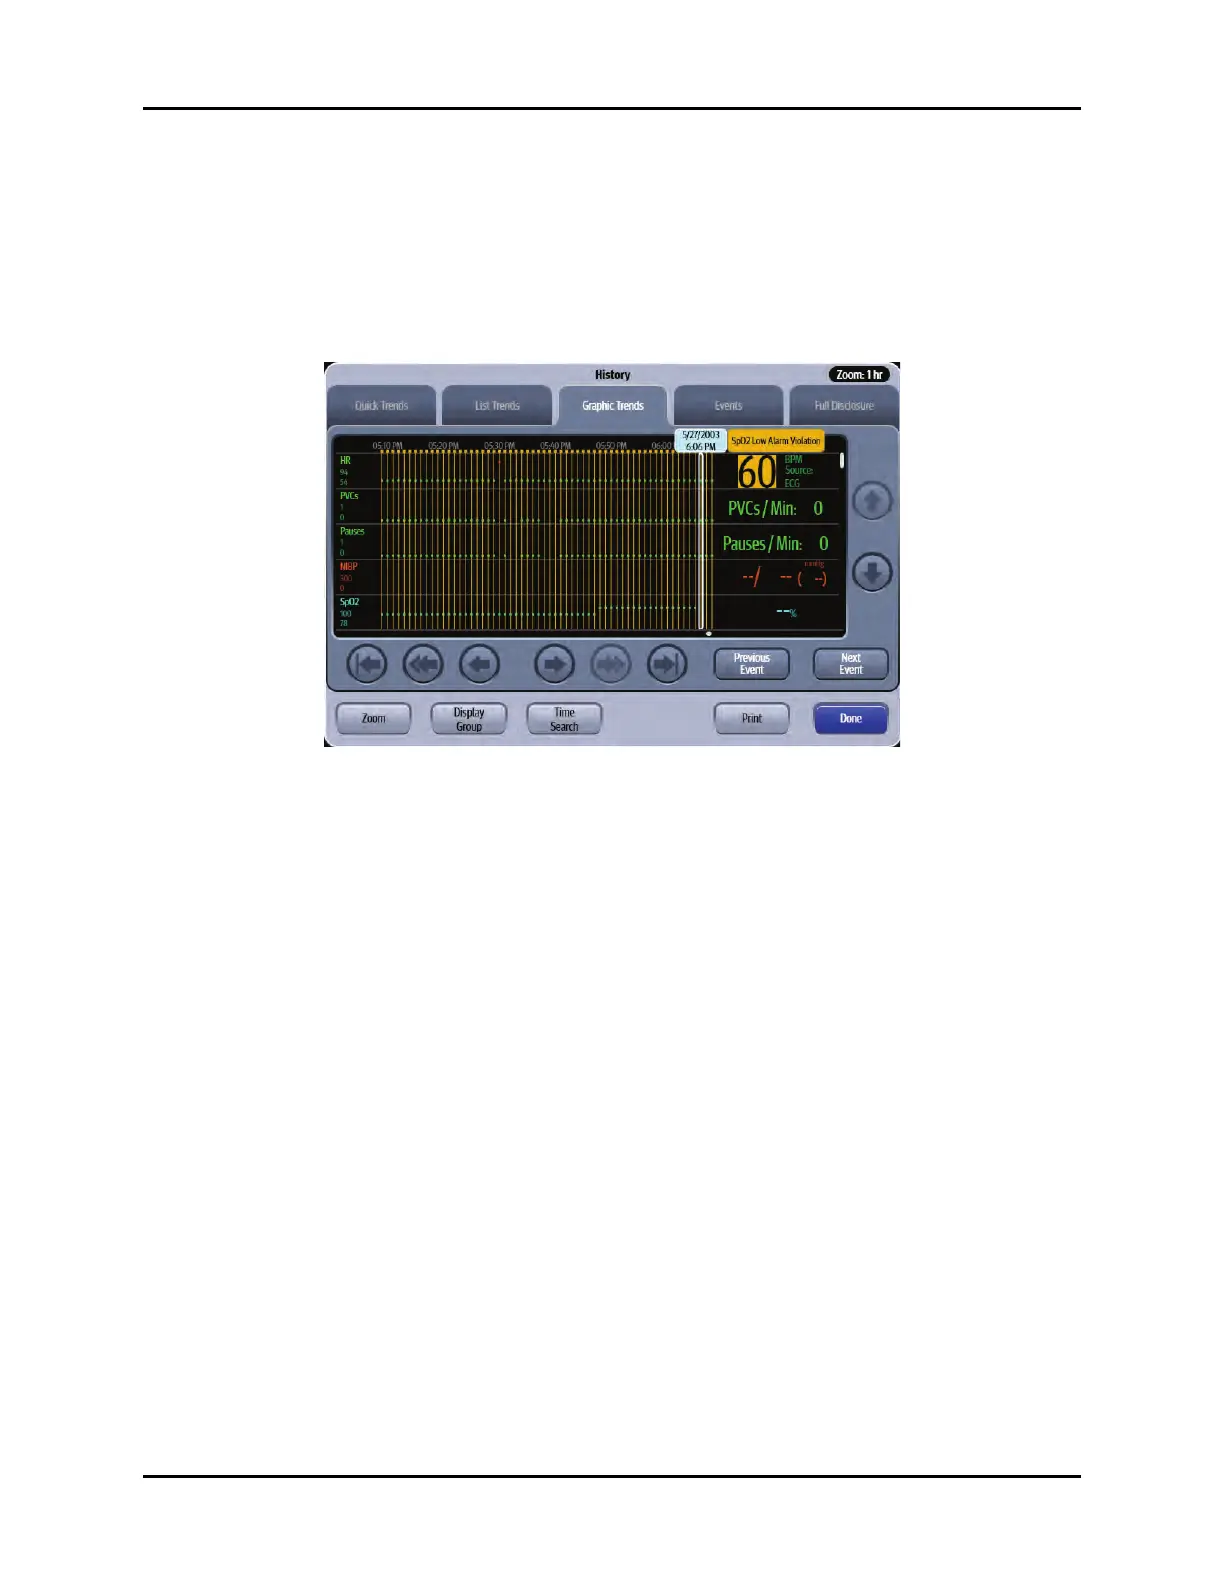
2. Select the Graphic Trends tab (as shown in FIGURE 21-3).
NOTE: The display interval in FIGURE 21-3 is configured for one (1) hour. Refer
to "Configuring a Display Interval" on page 21-15 for more information.
FIGURE 21-3 Example History Dialog (Graphic Trends Tab)
21.2.13 About the Graphic Trends Tab
• The Graphic Trends area displays a trend digital tile adjacent to each trend graph.
• The Graphic Trends area always displays the heart rate (HR) as the first trend graph and it is fixed
in the top row position.
• The Graphic Trends area displays the trend data in the time range specified in the Display Interval.
• The Graphic Trends provides a trend cursor which moves around the historical data based on
which navigation button is selected.
• The Graphic Trends area displays the date and time of the trend cursor.
• The Graphic Trends area displays a blank tile when no trend data is available for the configured
parameter.
• The Graphic Trends horizontal scale is automatically scaled to present the entire waveform at the
maximum height.
• The Graphic Trends area displays a vertical event marker line for each historical event. The event
marker line extends from the top of the trend graph to the bottom.
• The event marker contains the event date and time and the event message.
• The event marker line displays in the color corresponding to the priority of the event.
• The event marker lines displays the event with the highest priority when multiple events
occur at the same time.