8 Operation
Maschinenfabrik Reinhausen GmbH 2020222 3587317/21 ENTAPCON
®
Trend curves
If you call up the measured value recorder using a PC, you can display a
trend curve instead of the measured values. The trend curve can, for exam-
ple, be a moving average over a configurable time period.
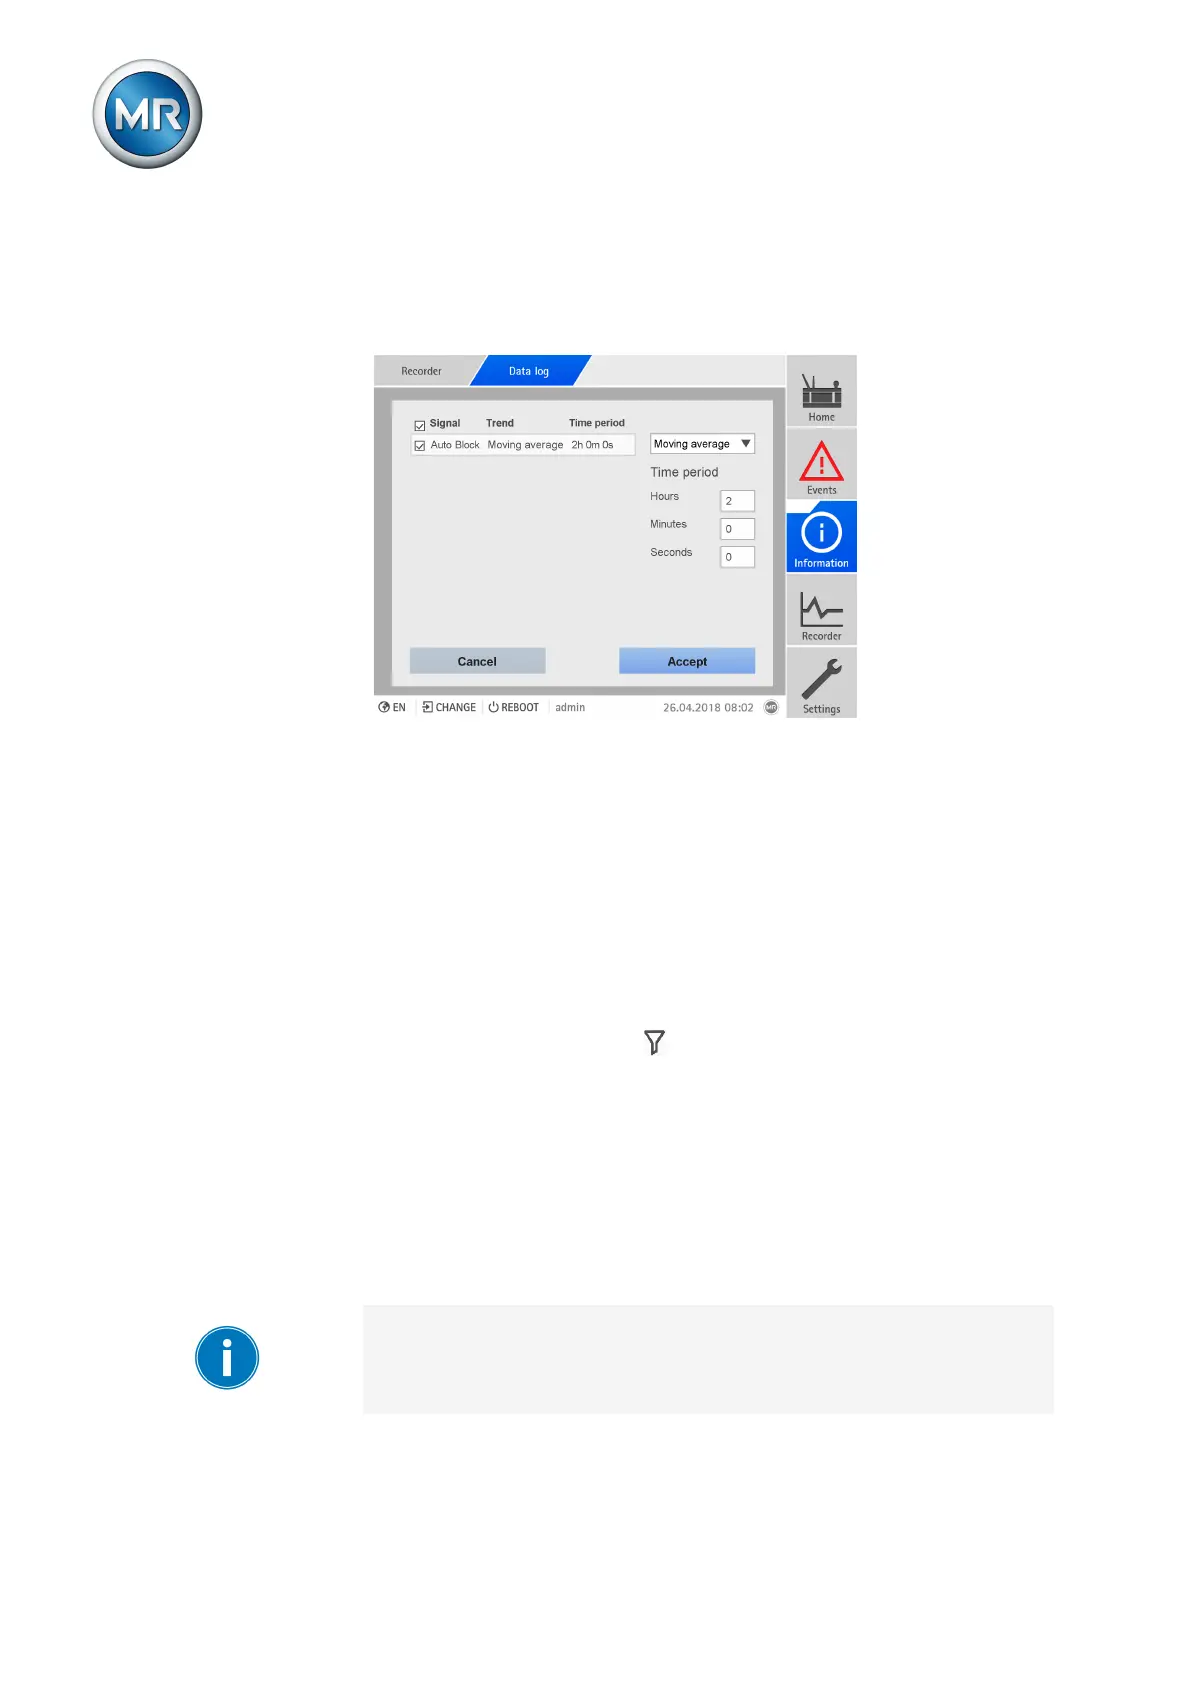
Figure152: Creating trend curves
To create the trend curves, proceed as follows:
1. Call up the measurement recorder and the desired measured value se-
ries.
2. Press the Trend button.
3. Select the desired measured values.
4. Select the desired trend function.
5. Entire the desired time period for the calculation of the trend curve.
6. Press the Accept button to display the trend curves.
ð The trend curve is displayed. Measured values that are displayed as trend
curves are marked with the symbol.
8.20.3 Setting the measured value recorder
The measured value recorder records a maximum of 500,000 values per
measured variable. Depending on the set average value interval, the mea-
sured value recorder can display the measured values over a shorter or
longer time period:
▪ Average value interval = 1s: approx. 6 days
▪ Average value interval = 86,400s (= 24h): approx. 1340 years
Note that, for measured values via analog input signals (e.g. temperature),
a maximum of 100,000 measured values with an average value interval of
3,600 s (= 1 h) will be saved. This is equivalent to a time period of approx.
11 years.