Monitoring System Access and Performance
455
ProSecure Unified Threat Management (UTM) Appliance
Monitor Application Use in Real-Time
If you have enabled application session monitoring (see Enable Application Session
Monitoring on page 492), the Application Dashboard screen lets you monitor the use of
applications and protocols in real-time. To display the Application Dashboard screen, select
Monitoring > Application Dashboard.
Except for setting the poll interval, changing the monitoring period, and selecting the filter,
you cannot configure the fields on the Dashboard screen. Any changes need to be made on
other screens.
You can sort the fields of the table below the graphics, which will affect the displayed
graphics, and you can display application details onscreen by clicking a View table button in
the Details column. Move the cursor over the graphics to display additional information.
Note: Adobe Flash Player 10 or later is required to display the graphics.
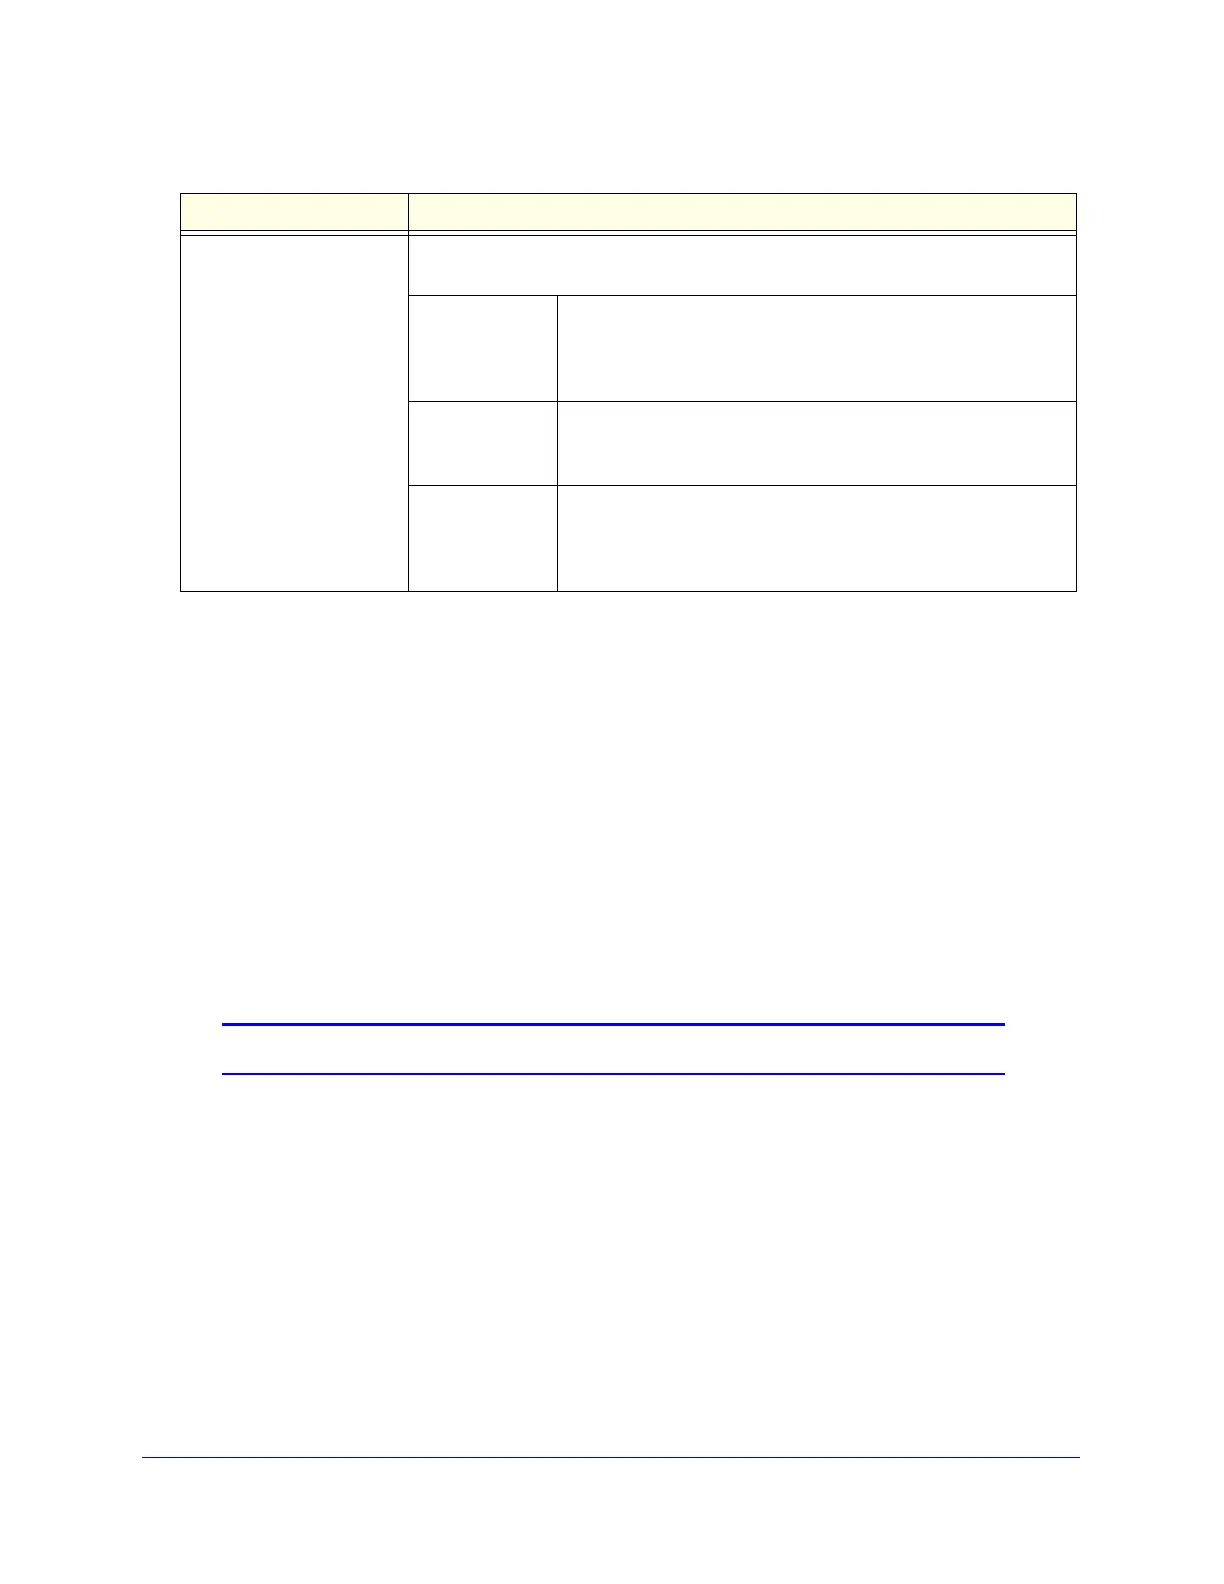
Total Spam Emails The total number of spam messages that were blocked. These statistics are
applicable only to SMTP and POP3.
Blacklist The total number of emails that were detected from sources on
the spam blacklist (see Set Up the Whitelist and Blacklist on
page 194). These statistics are applicable only to SMTP and
POP3.
RBL The total number of emails that were detected from sources on
the real-time blacklist (see Configure the Real-Time Blacklist on
page 196). These statistics are applicable only to SMTP.
Distributed Spam
Analysis
The total number of spam messages that were detected through
distributed spam analysis (see Configure Distributed Spam
Analysis on page 198). These statistics are applicable only to
SMTP and POP3.
Table 115. Dashboard screen: service statistics information (continued)
Item Description