Monitoring System Access and Performance
502
ProSecure Unified Threat Management (UTM) Appliance
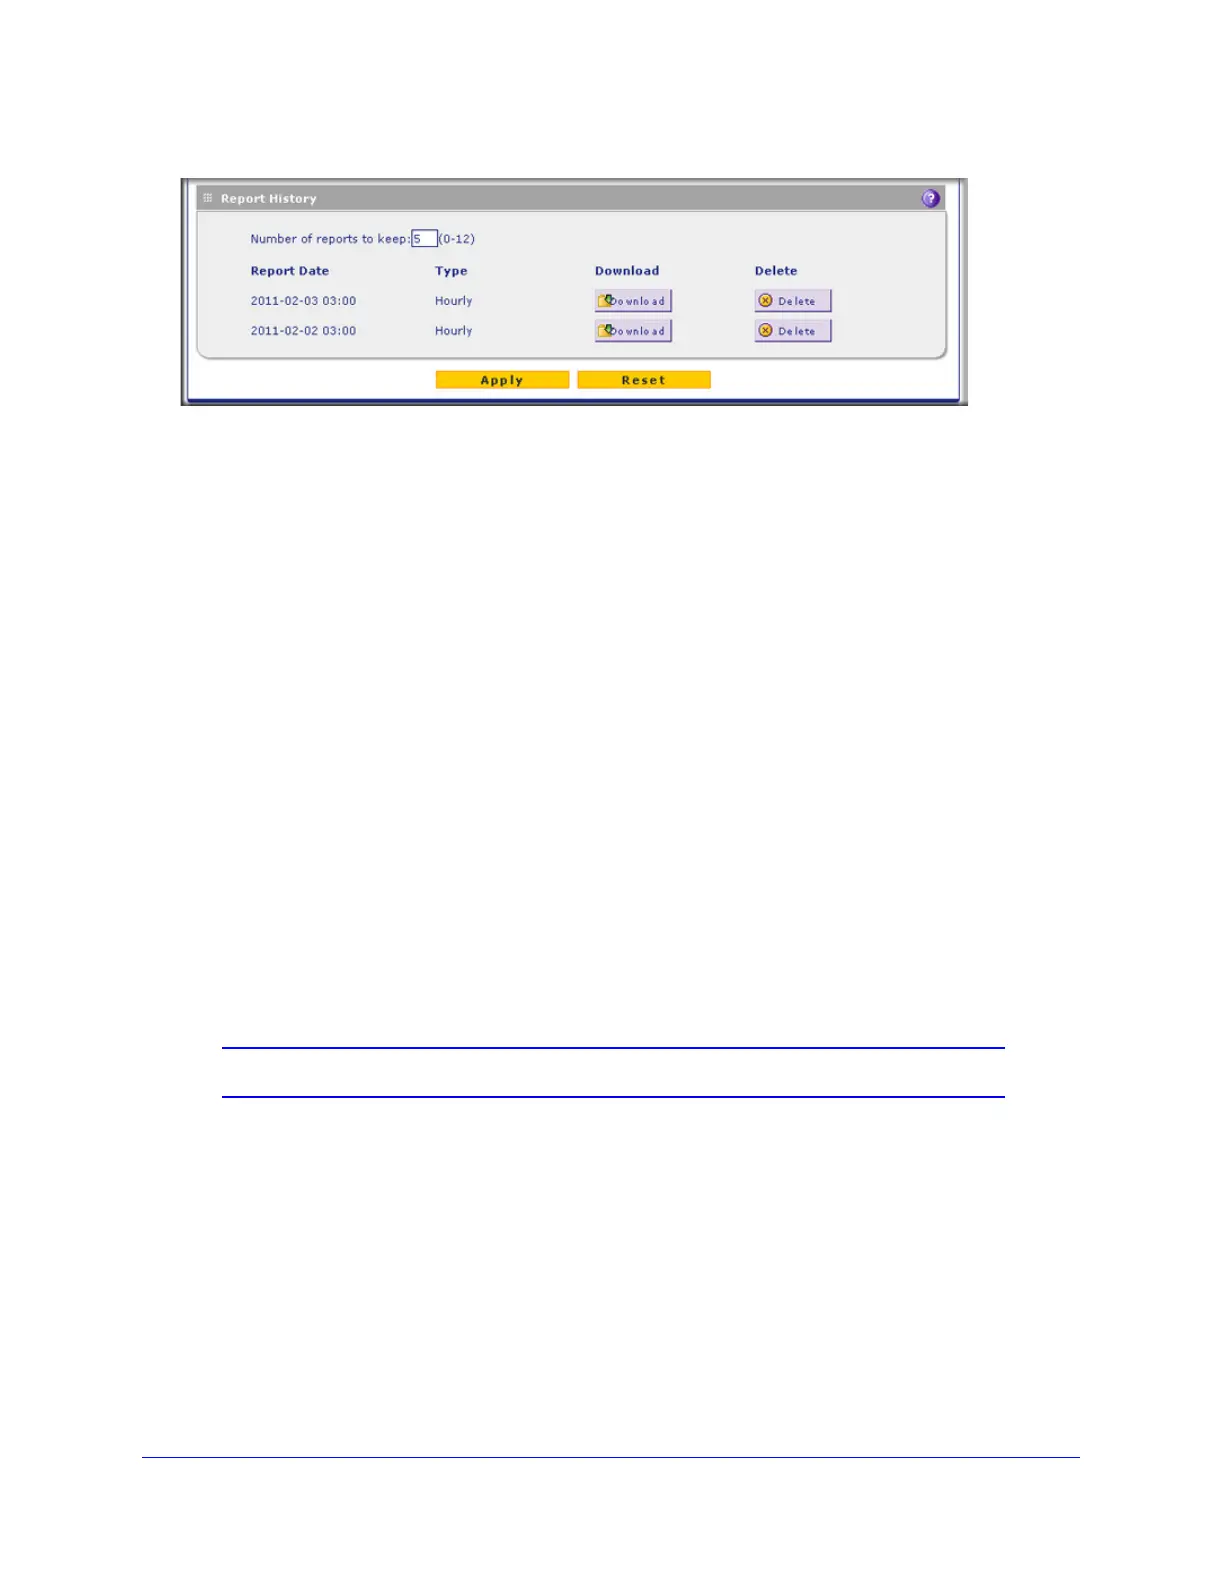
Figure 298. Report, screen 4 of 4
The Report History section shows the generated and emailed reports with their report date
and lets you perform the following actions.
• Specify the number of reports to keep. To manage the number of reports that you can
keep, enter a number from 1 to 12 in the Number of reports to keep field. The default
number is 5 reports.
• Download a report. Click Download next to a report to download the report to your
computer.
• Delete a report. Click Delete next to a report to delete the report.
Use Diagnostics Utilities
The UTM provides diagnostic tools that help you analyze traffic conditions and the status of
the network. Two sets of tools are available:
• Network diagnostic tools. These tools include a ping utility, traceroute utility, and DNS
lookup utility, and the option to display the routing table.
• Traffic diagnostic tools. These tools allow you to perform real-time, per-protocol traffic
analysis between specific source and destination addresses, and let you generate reports
on network usage in your network.
Note: For normal operation, diagnostic tools are not required.
The diagnostic tools are described in the following sections:
• Use the Network Diagnostic Tools
• Use the Real-Time Traffic Diagnostics Tool
• Gather Important Log Information and Generate a Network Statistics Report
To display the Diagnostics screen, select Monitoring > Diagnostics. To facilitate the
explanation of the tools, the Diagnostics screen is divided and presented in this manual in
three figures.