Configuration Printer
A29247-X6-X-6-7670 195
How is this function to be used?
The sliders of the dialog (see above) represent a mathematical curve, which leads in its de-
fault position almost linear from the bottom left corner to the top right corner of the window.
This results in a linear - therefore even - conversion of the input grey values to the output
unit. The drawing below illustrates the connections between in- and output.
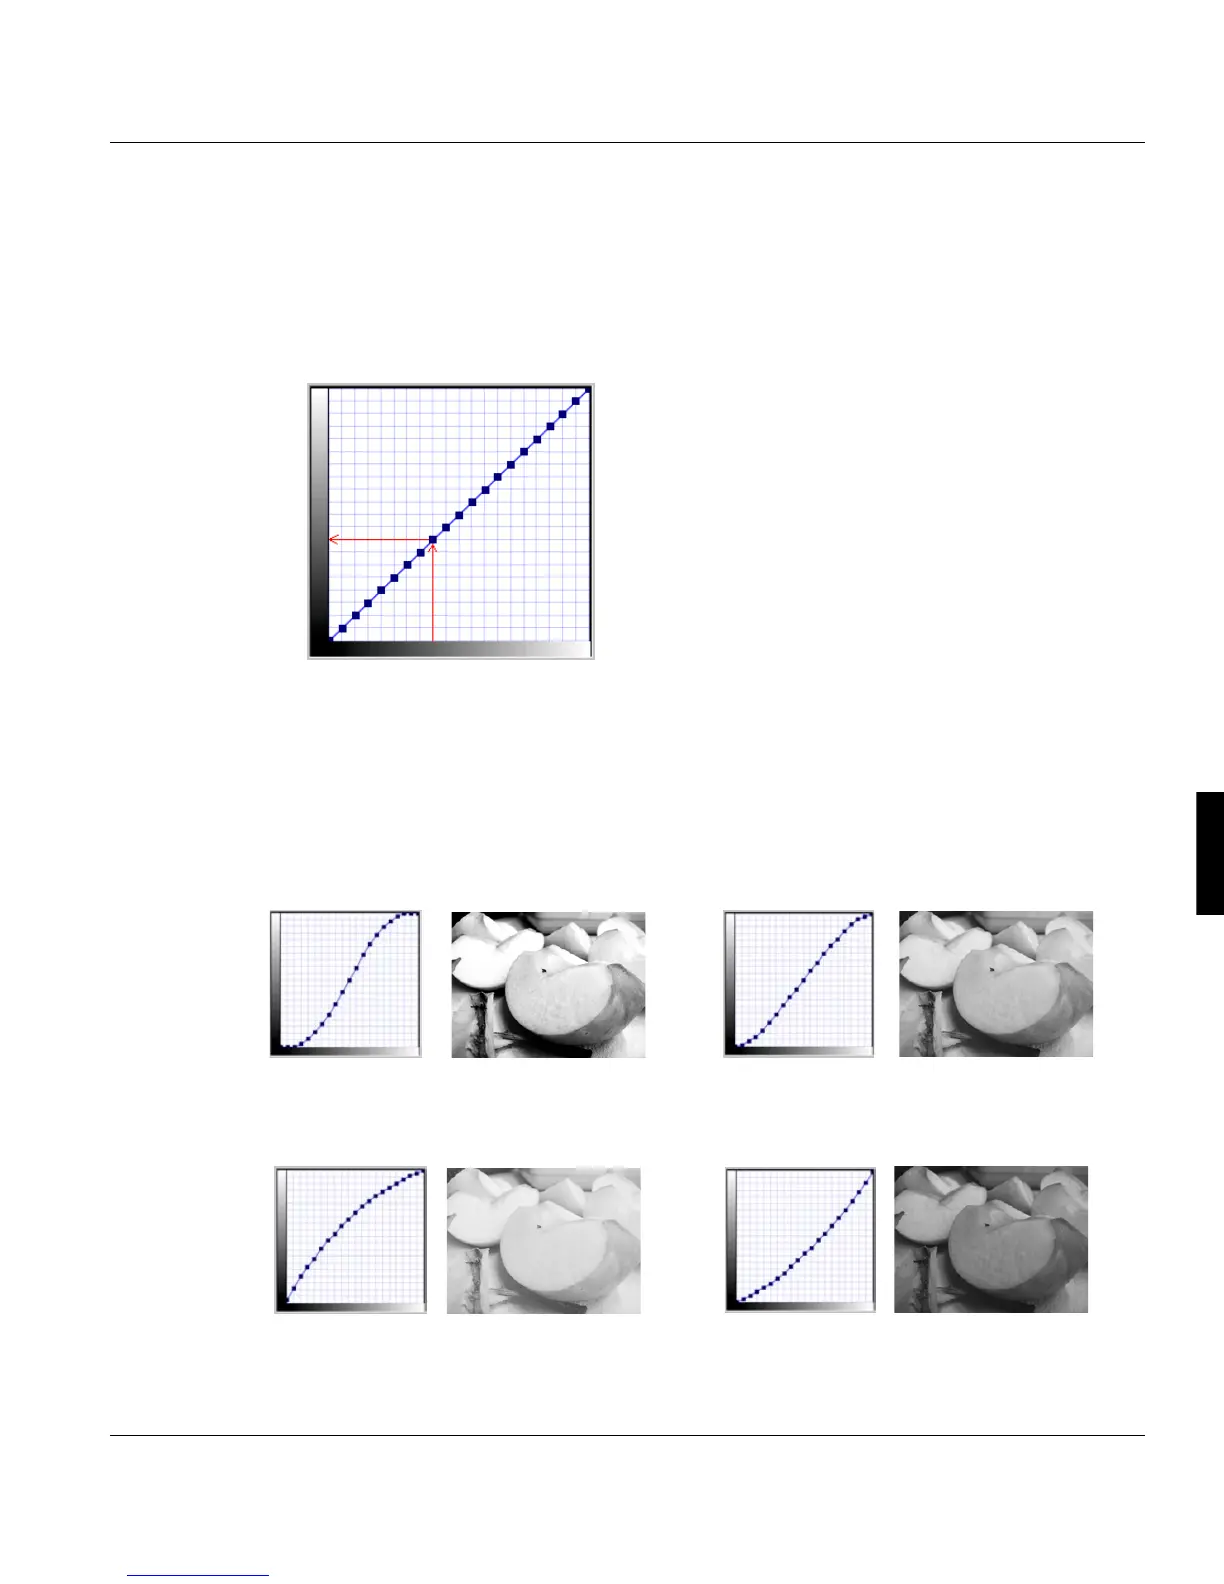
The axis (left) represents the grey shades the out-
put unit (in this case the printer) is capable of. The
horizontal axis (bottom) represents the grey shades
of the input unit (here PS or PDF).
The transfer curve now behaves like a axis of reflec-
tion, with which from the grey values of the bottom
axis the values of the left axis are calculated. If the
course of the curve gets more flat, the range and
the position of the grey values of the left axis will be
shifted down. This has the effect that in the output
data stream not the whole spectrum of possible
grey values is supported and the resulting images
will be darker with less contrast. Shifting the whole
curve up results in an evenly brighter image, shifting the whole curve down darkens the im-
age. To specificly change critical areas of an image like dark shadows and bright lights, it
is sufficiant to move the dots of the respective areas. To avoid rough changes and gaps in
the gradiant, the curve is usually shaped as an ’S’ or a bow with smooth transitions.
Examples:
High contrast: The differemce between bright
and dark are very distinct.
Low contrast: The differemce between bright
and dark are not so distinct, the image seems to
be a bit ’flat’.
Brighter in the middle.
Darker in the middle
The grey shades of the PS or PDF datastream
are displayed horizontally
The grey shades of the output unit (Printer)
are displayed