Common Analysis and Display Functions
R&S
®
FSVA3000/ R&S
®
FSV3000
499User Manual 1178.8520.02 ─ 01
2
1
3
4
6
8
7
5
8
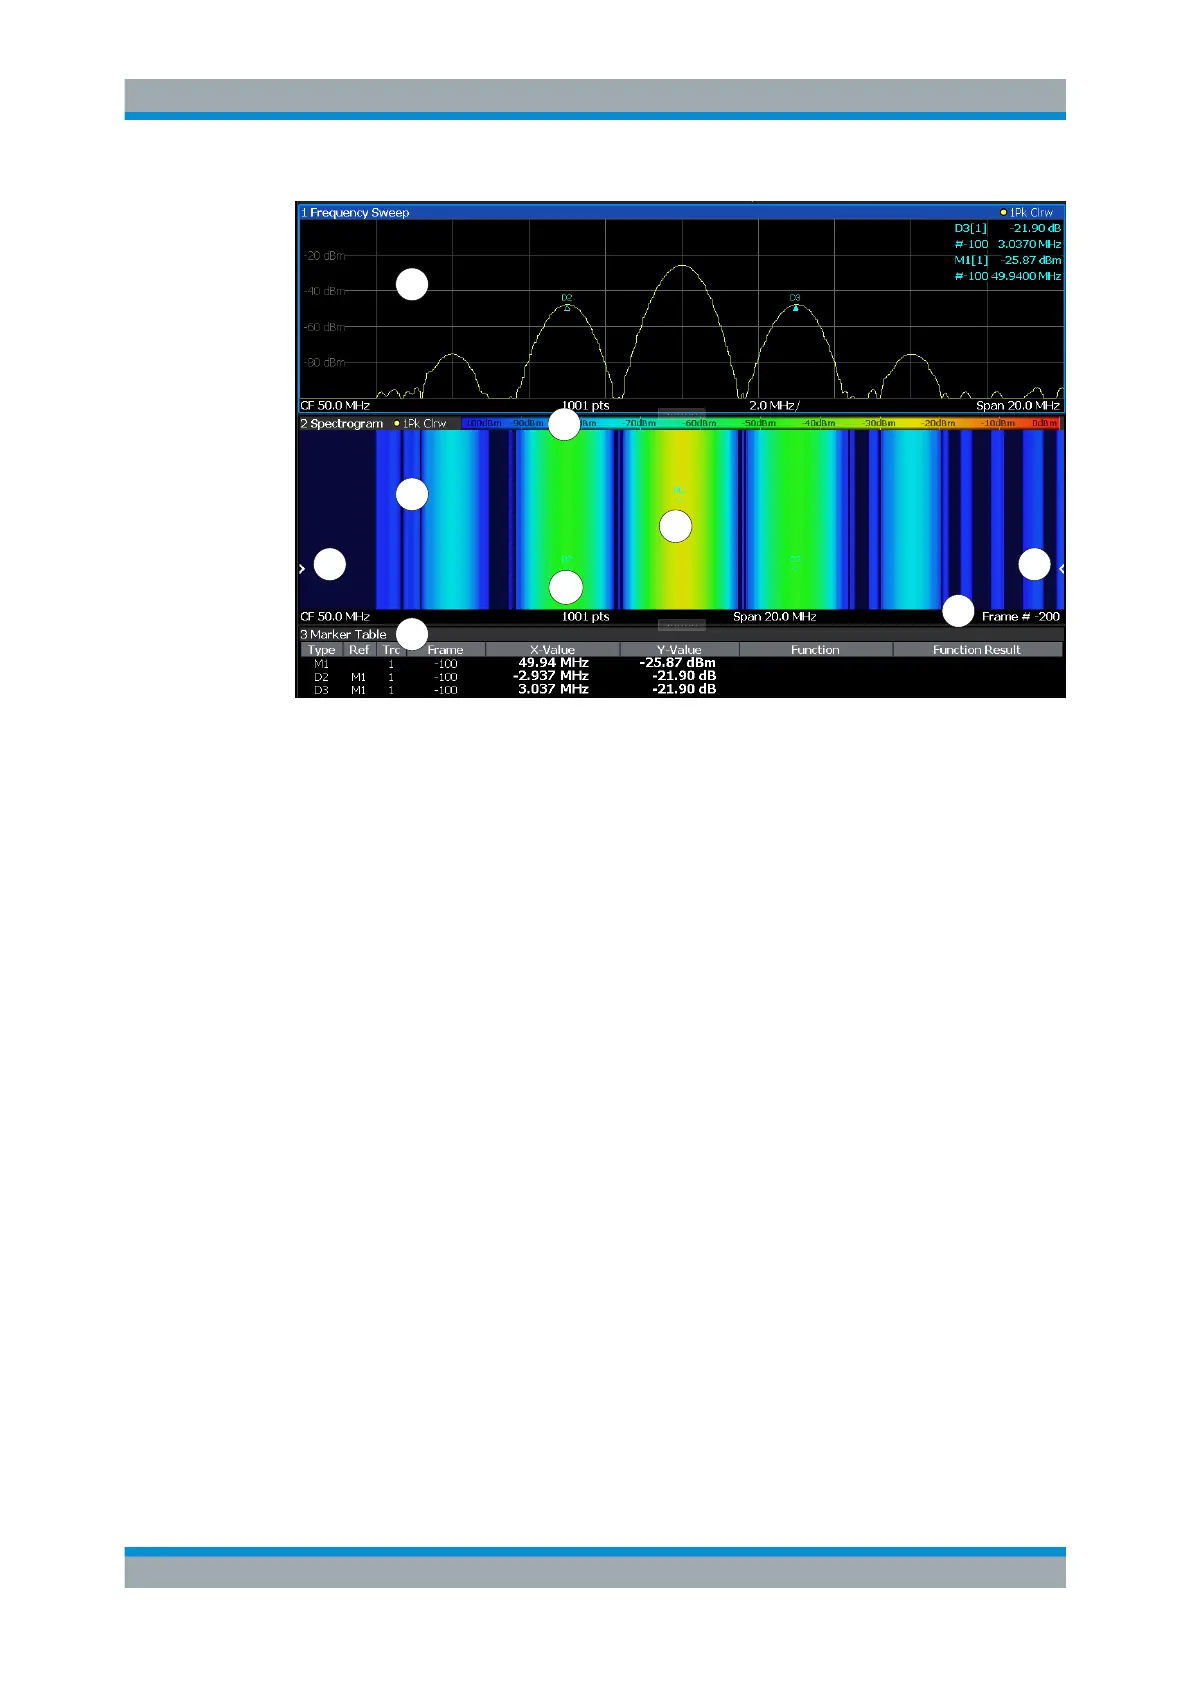
Figure 9-14: Screen layout of the spectrogram result display
1 = Spectrum result display
2 = Spectrogram result display
3 = Marker list
4 = Marker
5 = Delta marker
6 = Color map
7 = Timestamp / frame number
8 = Current frame indicator
For more information about spectrogram configuration, see Chapter 9.5.2.2, "Spectro-
gram Settings", on page 507.
Remote commands:
Activating and configuring spectrograms:
Chapter 14.8.2.2, "Configuring Spectrograms", on page 965
Storing results:
MMEMory:STORe<n>:SPECtrogram on page 1086
● Time Frames......................................................................................................... 499
● Markers in the Spectrogram..................................................................................501
● Three-Dimensional Spectrograms........................................................................ 502
● Color Maps............................................................................................................503
Time Frames
The time information in the spectrogram is displayed vertically, along the y-axis. Each
line (or trace) of the y-axis represents one or more captured sweep and is called a
Trace Configuration

 Loading...


