Scope and Multimeter Operations Main Screen and Toolbars
107
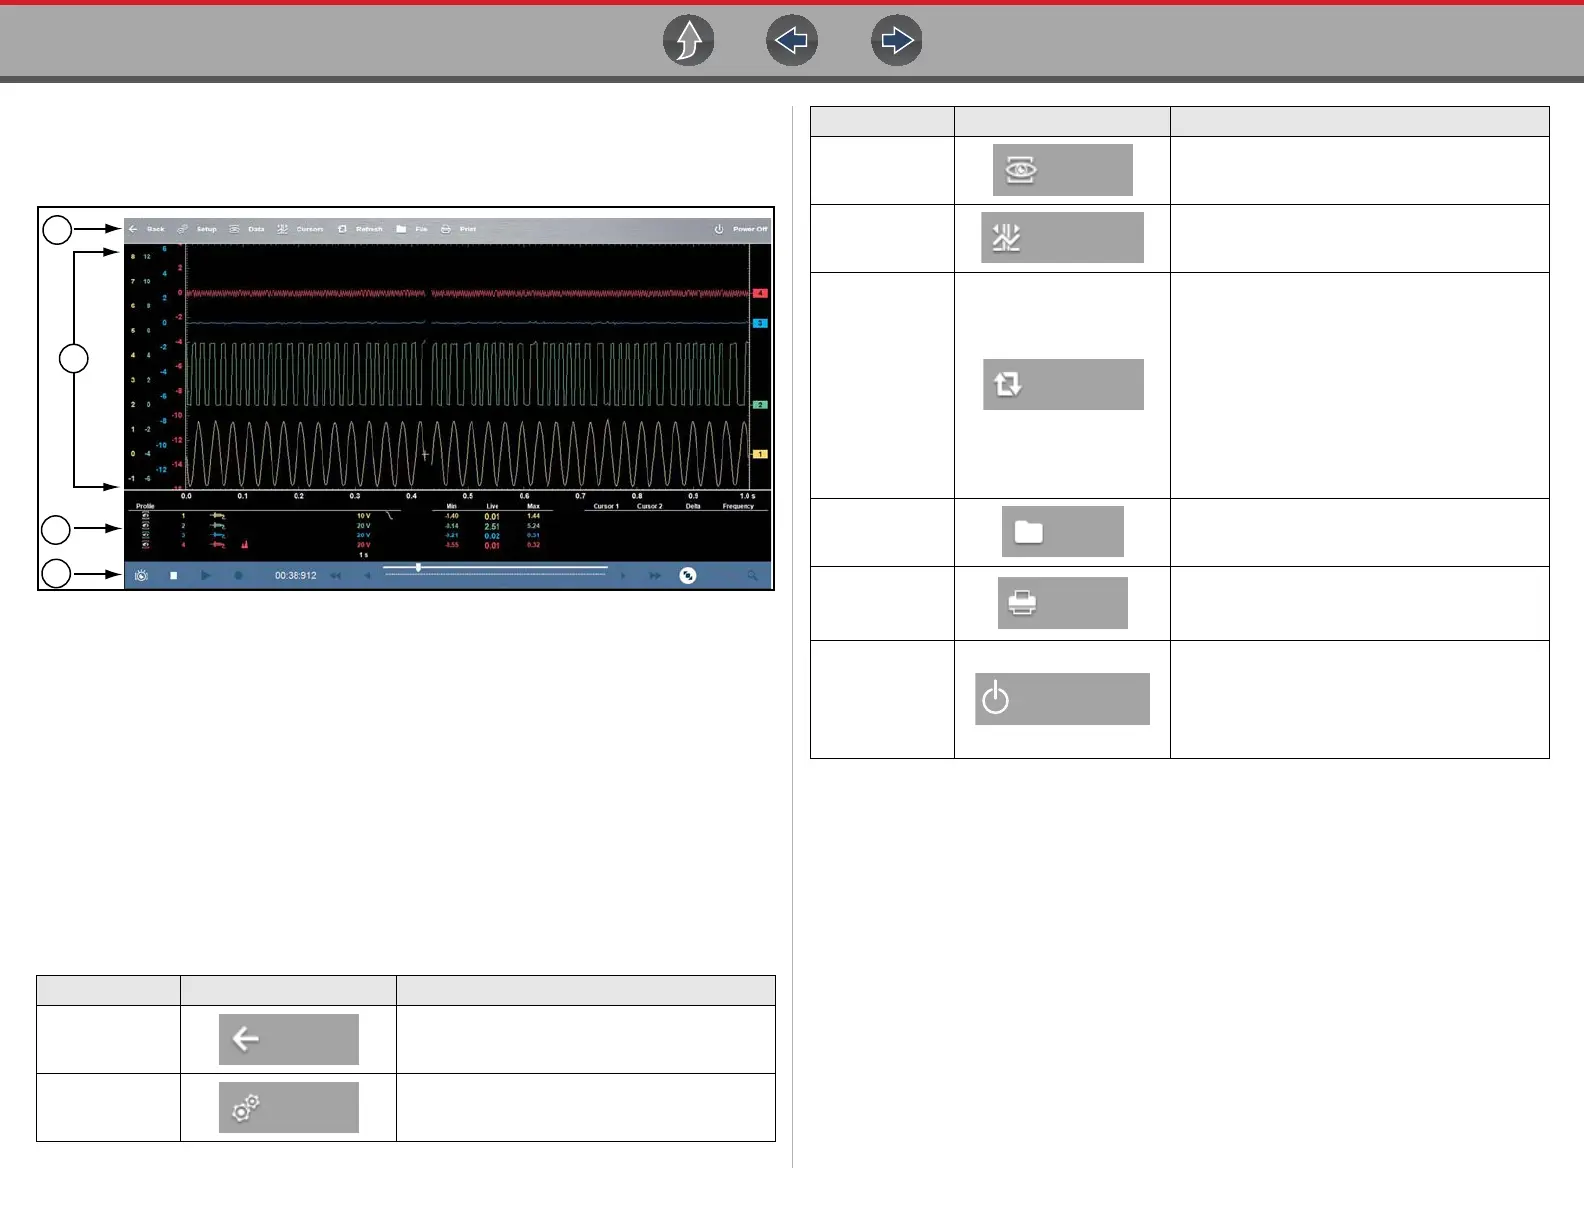
9.7 Main Screen and Toolbars
The scope/meter screens typically include the following sections (Figure 9-10):
1. Scope/Meter Toolbar - contains various navigational, and control icons
2. Main Body - contains the meter/scope display
3. Control Panel - contains channel/trace controls
Control Panel and Settings on
page 114
4. Lower Toolbar - includes icons to navigate through paused data
Figure 9-10 Scope Multimeter screen layout
9.7.1 Scope/Meter (Upper) Toolbar
The Scope/Meter toolbar is used to set up the tool for testing and to configure the
settings for each trace. The following table provides brief descriptions of the control
icons on the toolbar:
Name Icon Description
Back Returns to the previously viewed screen.
Setup
See
Setup Menu (Preferences) on
page 108
.
1
4
3
2
Data
Switches the display between three states.
See
Display Modes on page 114.
Cursors
See Cursors on page 125
Refresh
Clears the minimum, maximum and live
measurements displayed.
Uses:
• Track the variation in a component or circuit
under a certain condition. If the condition
changes, Refresh lets you start tracking
again to see the change.
• Verify that a connection problem you found
by looking for a dropout or spike in min/max
values has been fixed.
File
Allows you to select options for saving data.
See Saving Data on page 131
Print
Opens a standard Windows Print dialog box
that allows you to configure and print data.
See Printing / Printer Setup..
Power Off
Switches the Scope Multimeter off. This
retains the settings and reduces battery drain
when switching to a different module. The
Play and Record icons on the toolbar can be
used to switch the meter back on.
Name Icon Description