Sysmex XP-300 14-39
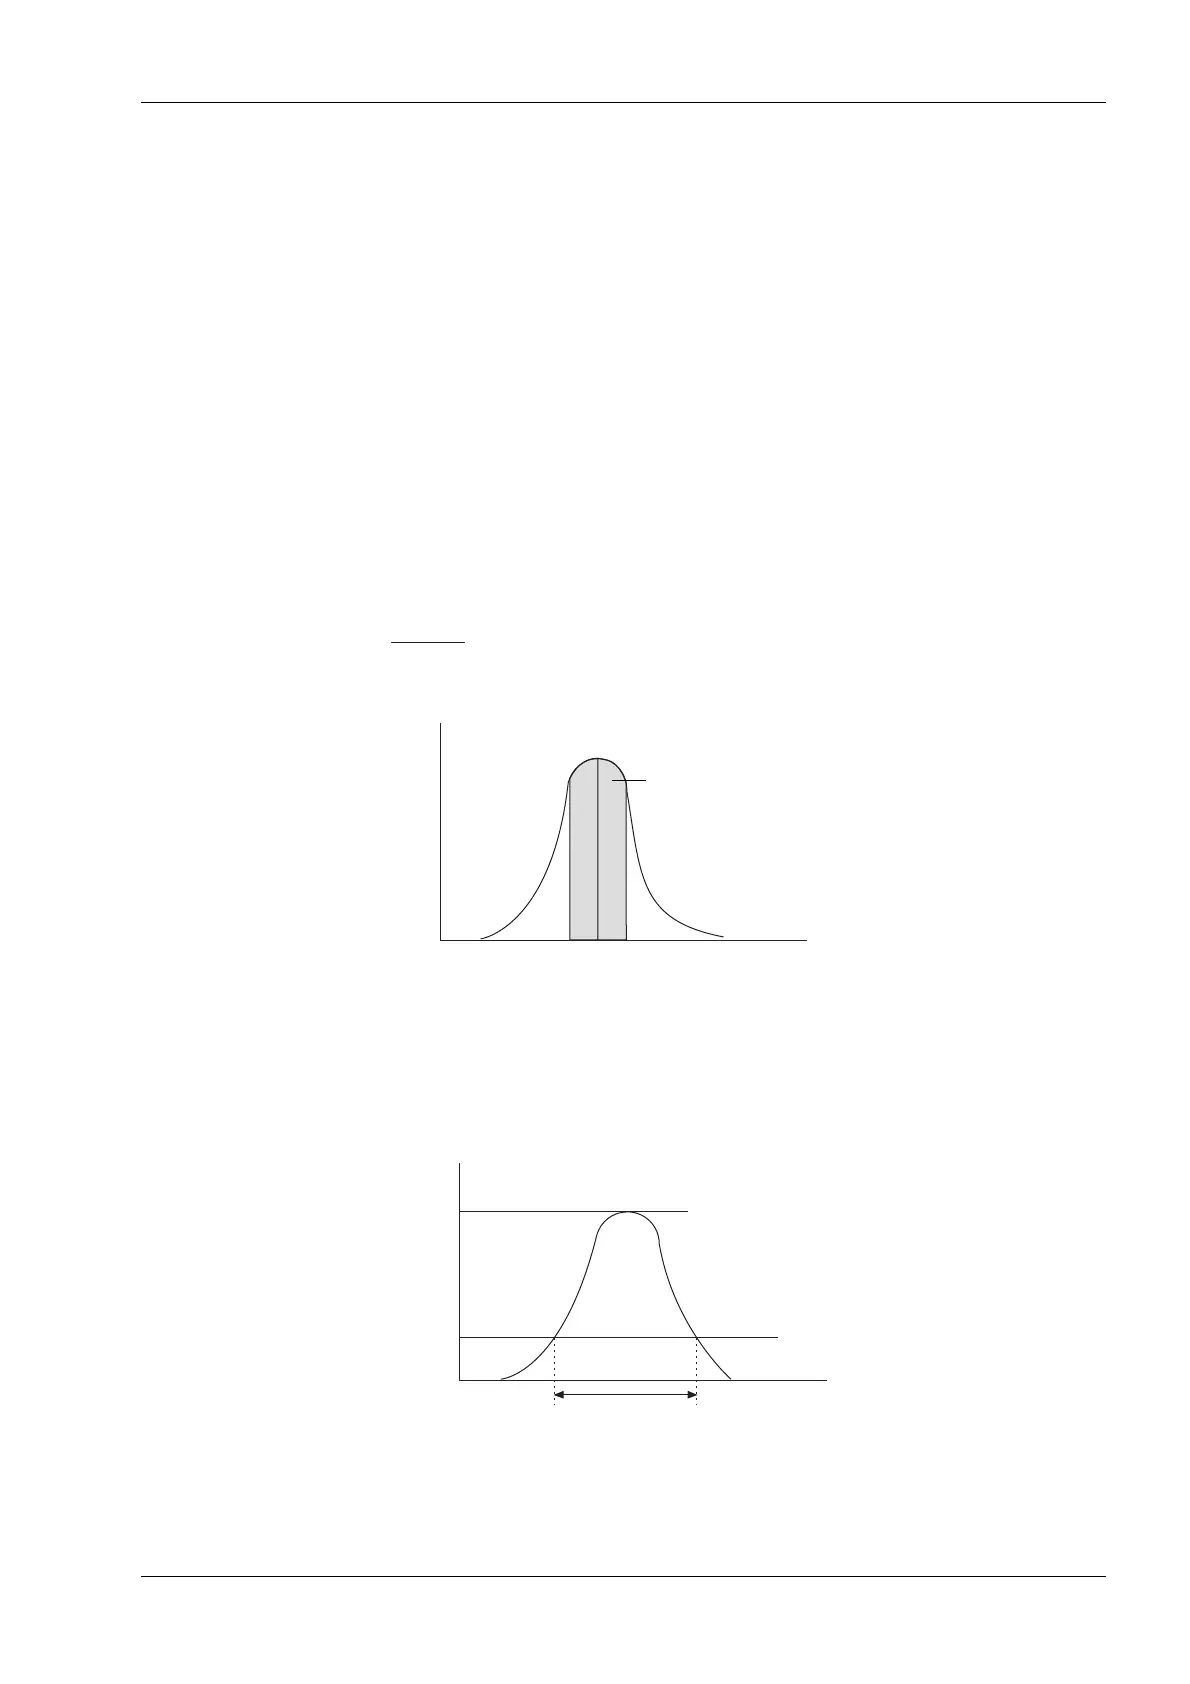
Technical Information
Revised June 2013
Analysis of RBC/PLT histogram
1. RBC Histogram
As mentioned earlier, RBC are determined as particle counts between 2 discriminators (LD) and
(UD) which are automatically counted in the ranges of 25 - 75 fL and 200 - 250 fL, respectively. As
to histogram, check is made for relative frequency errors on respective discriminator levels, for more
than one peak, and for distribution width error.
In addition, this instrument is capable of expressing RBC distribution width (RDW) by 2 methods
below:
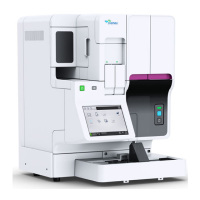
RDW-CV (RBC Distribution Width - Coefficient of Variation) is calculated by the formula below,
after determining points L1 and L2 for 68.26% of the entire particle area. The unit applied is %.
• Calculation of RDW-CV
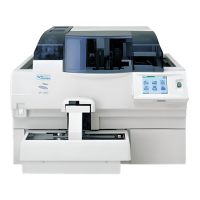
RDW-SD (RBC Distribution Width - SD) is set on 20% frequency level with the peak taken as 100%.
The unit applied is fL (femto-liter = 10
-15
L).
• Definition of RDW-SD
RDW-CV(%) = ×100
L
2
–L
1
L
2
+L
1
68.26% of Entire Distribution Area
100%
20%
RDW-SD