EasyManuals Logo

ACES SYSTEMS Cobra II User Manual

Default Icon
438 pages
To Next Page IconTo Next Page
To Previous Page IconTo Previous Page
Page #426 background imageLoading...
Page #426 background image
Chapter 24
Reading Spectrum and Scales
(Revision 2.10, Apr 2020)
The information in this chapter is provided to assist you in reading the graphical displays of the
various types of data that can be acquired using the Gen II Analyzers.
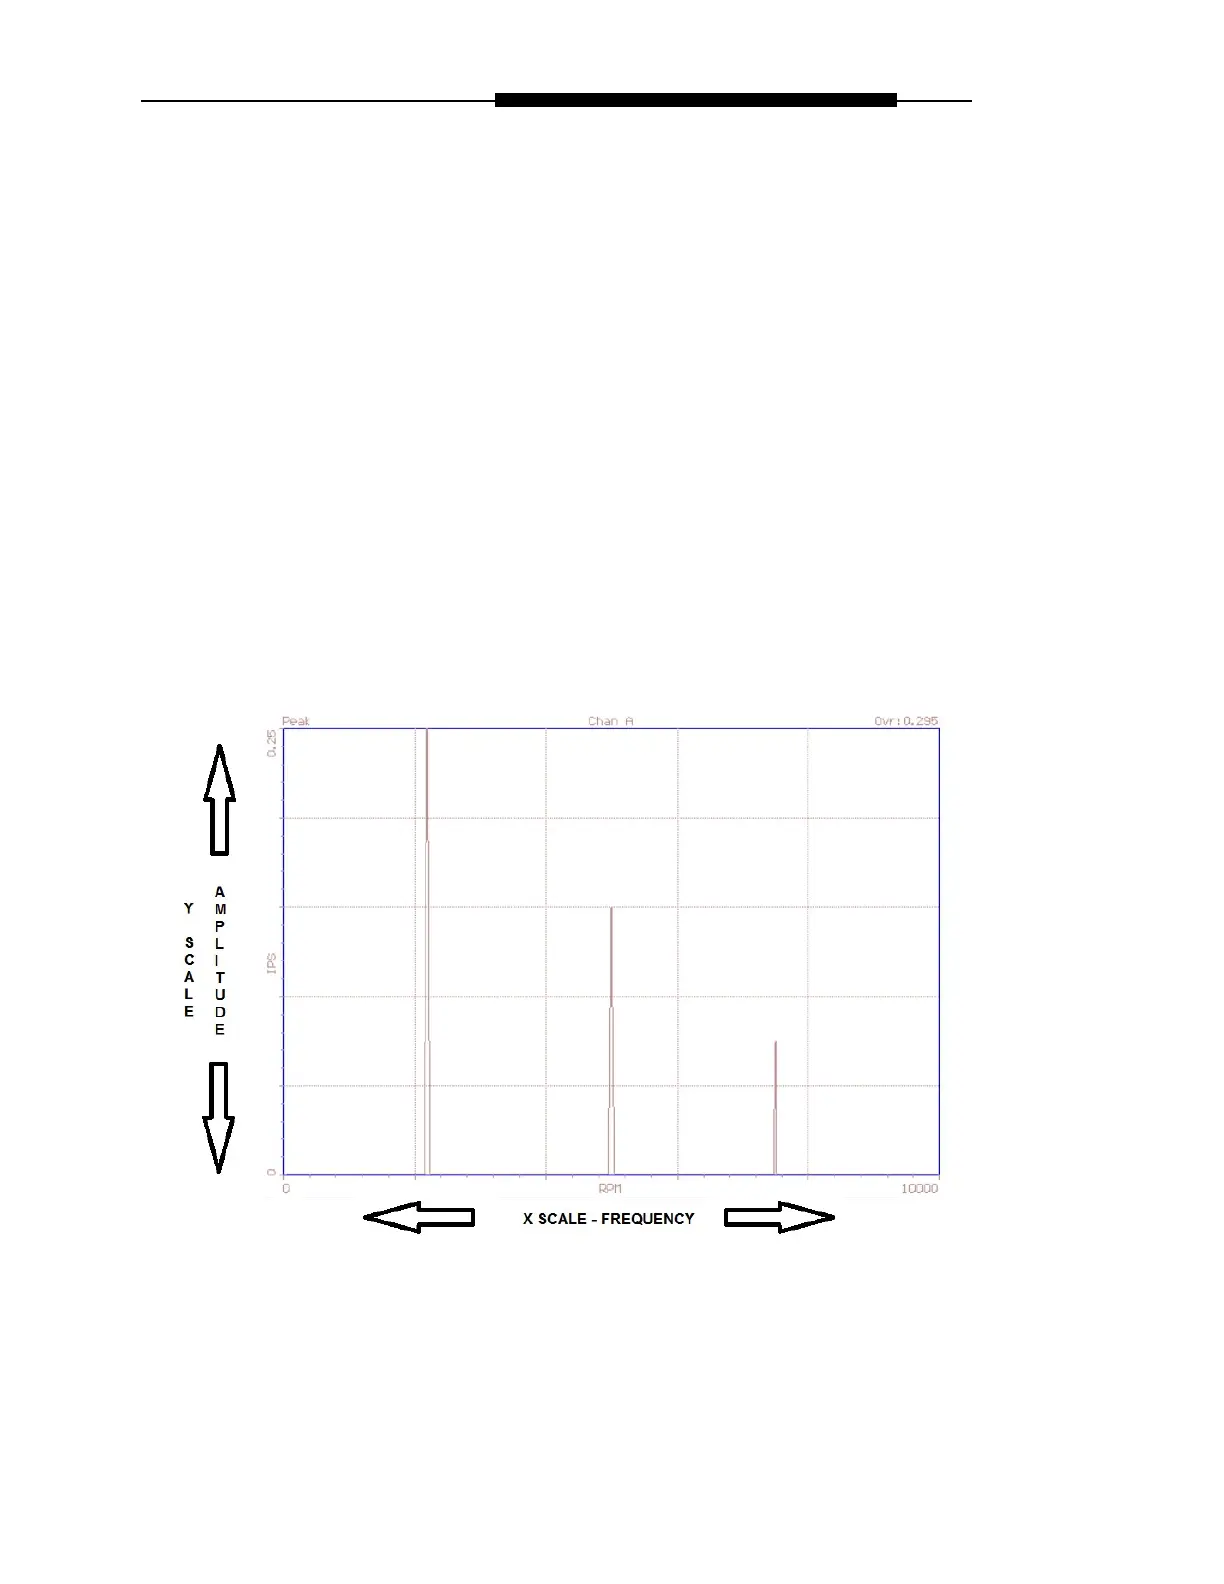
24.1. – Reading the X and Y Plotted Vibration Spectrum
A graphic spectrum display allows the user to investigate all aspects of a rotating component
related to vibration. In the figure above, the primary indicators are the plotted peaks that
represent component vibrations.

Table of Contents

Questions and Answers:

Question and Answer IconNeed help?

Do you have a question about the ACES SYSTEMS Cobra II and is the answer not in the manual?

ACES SYSTEMS Cobra II Specifications

General IconGeneral
BrandACES SYSTEMS
ModelCobra II
CategoryMeasuring Instruments
LanguageEnglish

Related product manuals