Gen II User Manual
24-2 – Reading Spectrum and Scales Chapter 24 Revision 2.10, Apr 2020
The scale of the “X” axis, along the lower horizontal edge, displays the frequency of interest in
Hertz (Hz), which is cycles per second, or in Revolutions per minute (RPM), as shown in the
figure. The frequency scale is a means of locating a component operating at a known number of
cycles per second (Hz) or minute (RPM).
The scale of the “Y” axis, along the left vertical edge, displays the amplitude or strength of the
component’s expended energy in the specified engineering units which in the figure above are
presented as IPS, or Inches Per Second, of movement.
24.2. – Reading the Converging Vibration Indicator and Scale
1
2
3
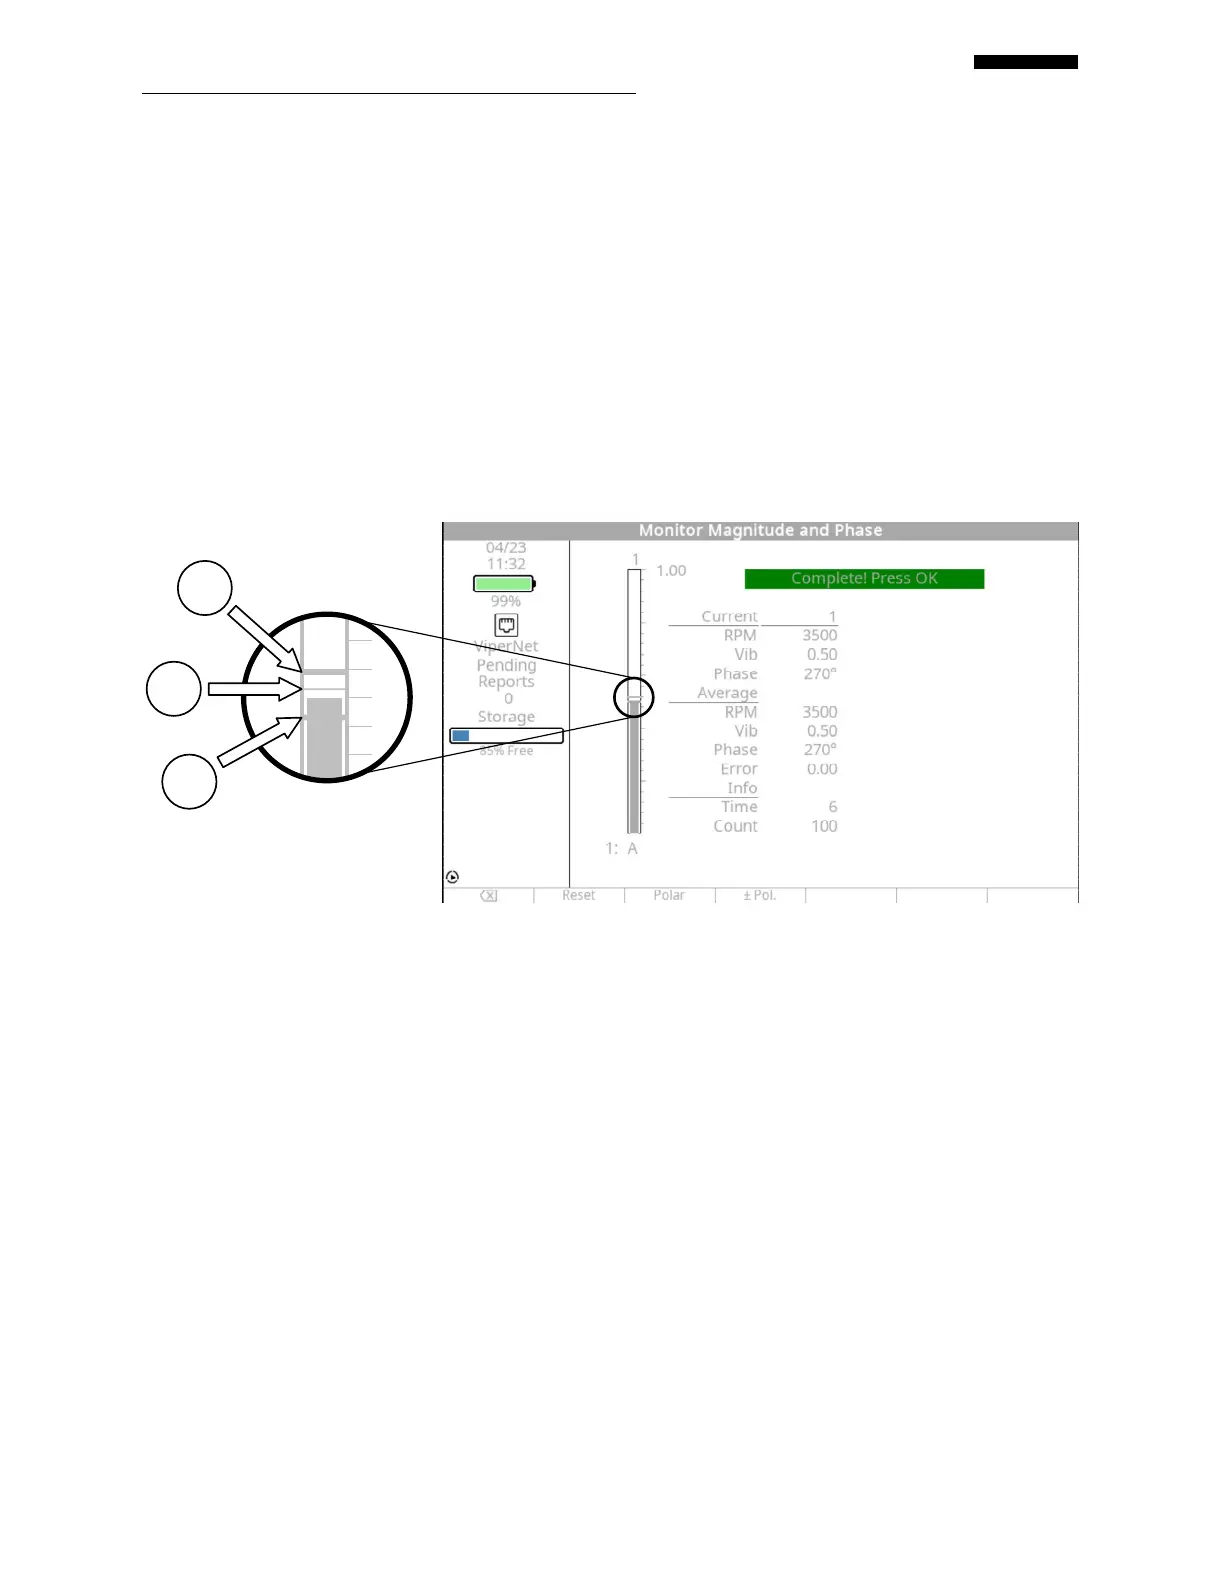
24.2.1. –Converging Indicator Scale
The converging vibration indicator and scale, as shown in the illustration above, appears in
several analyzer functions such as Propeller Balance, Rotor Track and Balance, Fan Trim
Balance, and IPS and Clock functions.
The scale is graduated along the right vertical side of the indicator from 0 at the bottom to the
upper end of the scale which is determined by the FSR (Full Scale Reading) setting. The vertical
indicator bar which begins at the bottom and continues upward in the center of the scale indicates
the current average amplitude by its upper end, relative to the adjacent scale. A thin horizontal
line (see arrow #2 in the figure above) indicates the latest collected (non-averaged) amplitude.
The lower error bar (see arrow #1 in the figure above) and the upper error bar (see arrow #3 in
the figure above) will converge on the average indicator as errors are averaged out of the
indication.
When collecting data with this indicator displayed, you should continue taking data until the
upper and lower error bars converge on the average indicator. The reported error will also
 Loading...