9500 MXC User Manual
3DB 23063 ADAA - Rev 004 July 2007 Vol. IV-15-63
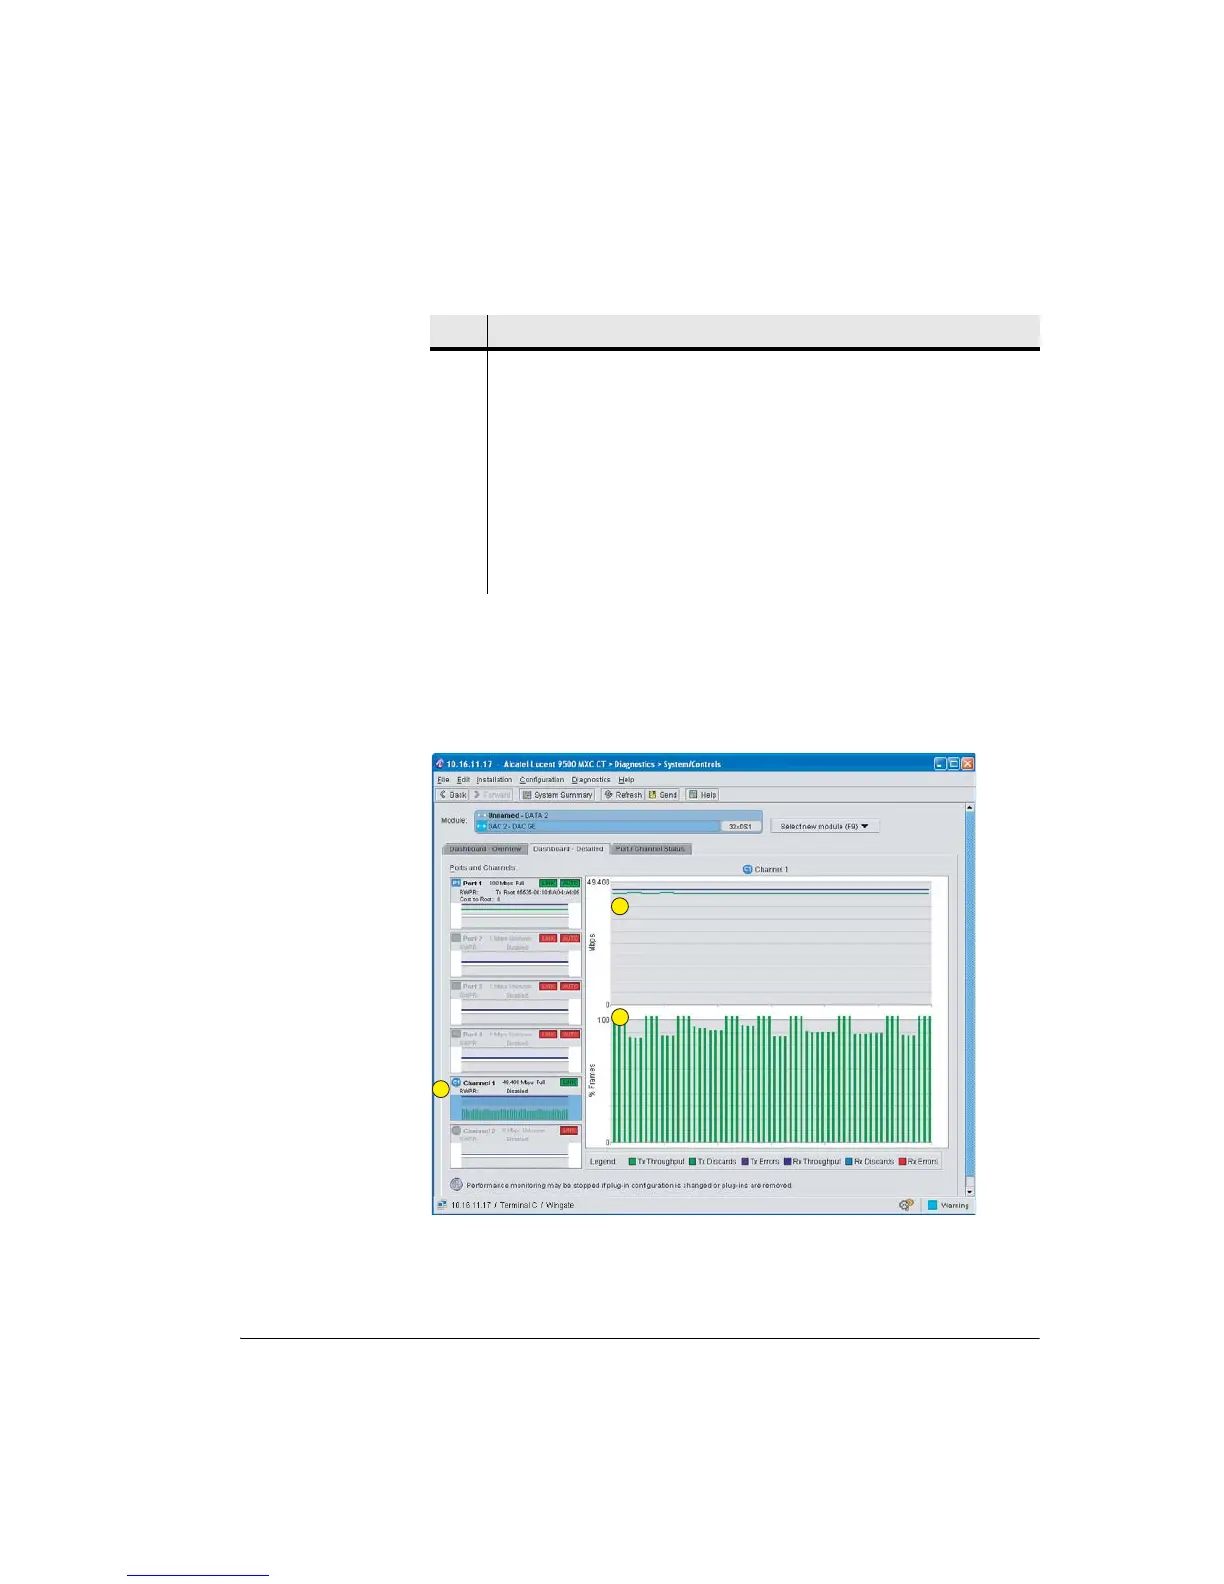
Dashboard Detailed
The Dashboard Detailed screen shows a detail view of a selected port or channel
for throughput, discards and errors. The higher resolution provides a good
indication of actual levels.
Figure 15-23. DAC GE Dashboard Detailed Screen
3, 4 Example shows that P1 is mapped to C1 using the Mixed operational mode. C1
capacity (link capacity) is set to 50 Mbps (49.4 Mbps), which is why the C1
graph indicates a 50 Mbps Tx discard rate; there is 100 Mbps ingressing P1, but
C1 capacity only supports a max throughput of 50 Mbps. (flow control is off).
4 Displays the operational mode selected in the Plug-ins screen.
5 RWPR settings for the DAC GE. Example indicates that RWPR has not been
enabled.
6 Icons indicates the Link plug-in(s) and slot location(s) for the links mapped to
channels C1 and C2.
Item Description
1
2
3