GAMATRONIC ELECTRONIC INDUSTRIES LTD.
+
SA: 20, 30 and 40 kVA, Release 2.1
49
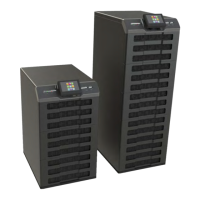
Figure 58: Normal operation indication
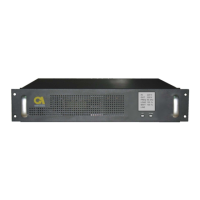
2. Connect the load and observe the results on the display.
LOAD LEVEL ---11:20:25---
L1: _____ 015A, 230V BATTERY: 864V
L2: ______ 012A, 230V UPS OK (ON)
L3: _______ 011A, 230V STSW OK (INV)
Load level
bar graph
Output
current
Output
voltage
Current
time
Battery
voltage
Status
indications
Figure 59: Main screen results
3. Observe that the “dot” bar graph now indicates the load presence and relative power
consumption. Filled dots indicate kW; filled dots plus empty dots indicate apparent
power in kVA.
POWER
+
start-up is now complete.