4.4 Basic Scanning Mode
154
CAUTION
•••••••••••••••••••••••••••••••••••••••••••••••••••••••••••••••••••••••••••••••••••••••••••••••••••••
• The [Stable Section] function displays the estimated interval in which stable pressurization takes place. It does not
display the diagnostic image.
•••••••••••••••••••••••••••••••••••••••••••••••••••••••••••••••••••••••••••••••••••••••••••••••••••••••••••••••••••••
IMPORTANT
•••••••••••••••••••••••••••••••••••••••••••••••••••••••••••••••••••••••••••••••••••••••••••••••••••••
• The following B-mode parameters change automatically when you enter Elastography-mode. The original values are
automatically restored when you exit Elastography-mode.
– [B Density] : If higher than [H], select [H]
– [Trapezoid] : [O]
– [Focus Pattern] : 1
• The following settings change automatically when you enter Elastography-mode. The original state is not restored
when you exit Elastography-mode.
– [Biopsy], [SNV] : [O]
– [ECG] : [O]
• When using Elastography-mode, M-mode/PW Doppler-mode/PW-TDI/Color ow/Power Doppler/SCF-mode cannot
be activated.
• When using Dual-mode, if one of the planes is in Elastography-mode, Biopsy, and ECG cannot be activated.
•••••••••••••••••••••••••••••••••••••••••••••••••••••••••••••••••••••••••••••••••••••••••••••••••••••••••••••••••••••
HINT
•••••••••••••••••••••••••••••••••••••••••••••••••••••••••••••••••••••••••••••••••••••••••••••••••••••
• Except when [O] is selected for [Equalization] uneven coloring can be alleviated.
•••••••••••••••••••••••••••••••••••••••••••••••••••••••••••••••••••••••••••••••••••••••••••••••••••••••••••••••••••••
Pressurization state navigation
Pressurization state navigation is a function for assisting the elastic image display operation.
To display the elastic image continuously, repeat following action: lightly pressurize the target site with the transducer
and then release the pressure.
Pressurization state navigation assists the operation by displaying the pressurization state in three ways (Navigation
types).
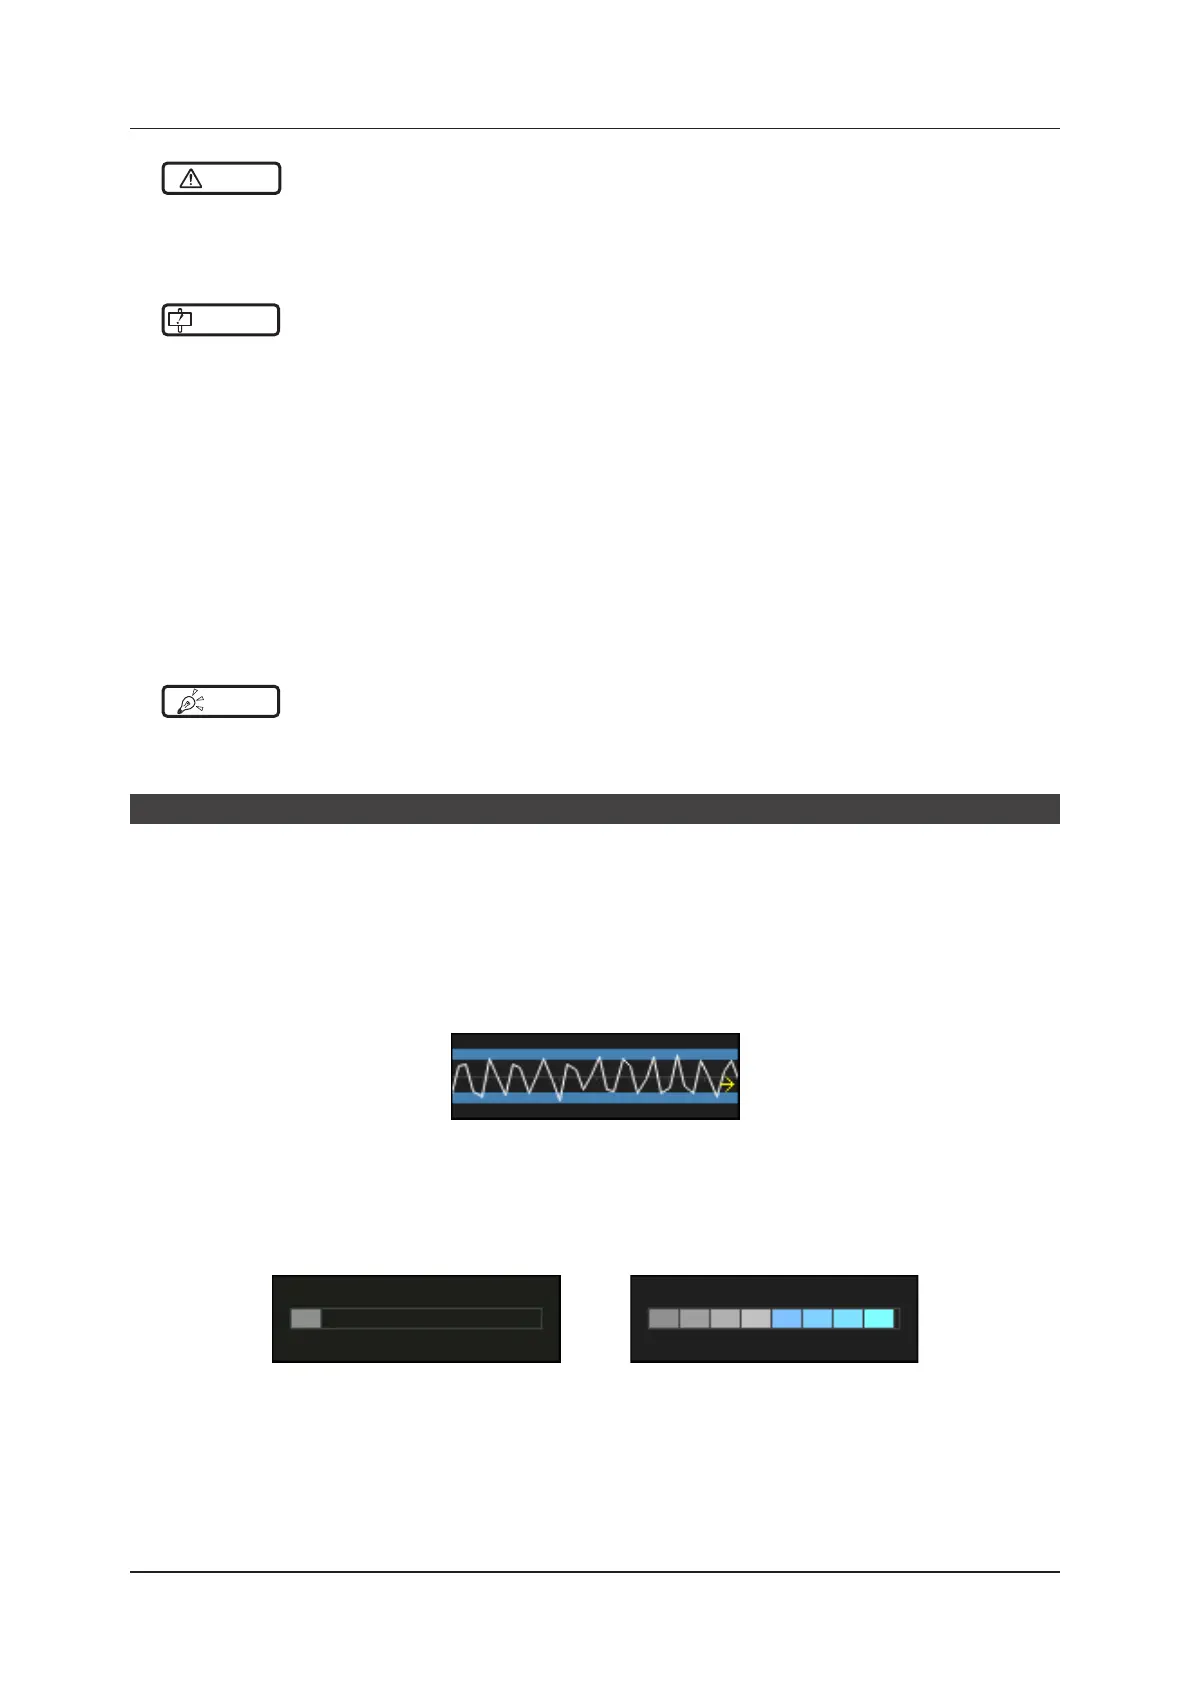
z
Navigation type 1
In Navigation type 1: The strain time variation is displayed by line chart.
If the line chart stays between the upper and lower blue lines, the elastic image can easily be displayed by re-
peating the pressurization and relaxation.
z
Navigation type 2
Minimum score display example Maximum score display example
Navigation type 2 displays the pressurization and relaxation repetitions as scores.
The higher the score the more easily the elastic image is displayed.