Model 831 Manual Adjust Graph Scale 5-29
Adjust Graph Scale
The default amplitude (dB) settings for the graphic display
of sound pressure level versus time and frequency spectra
(1/1 and 1/3 octave) are as indicated below:
• Level vs Time Graph: 20 dB to 140 dB
• Frequency Spectra, Normal Range: 20 dB to 140 dB
• Frequency Spectra, Low Range: -10 dB to 110 dB
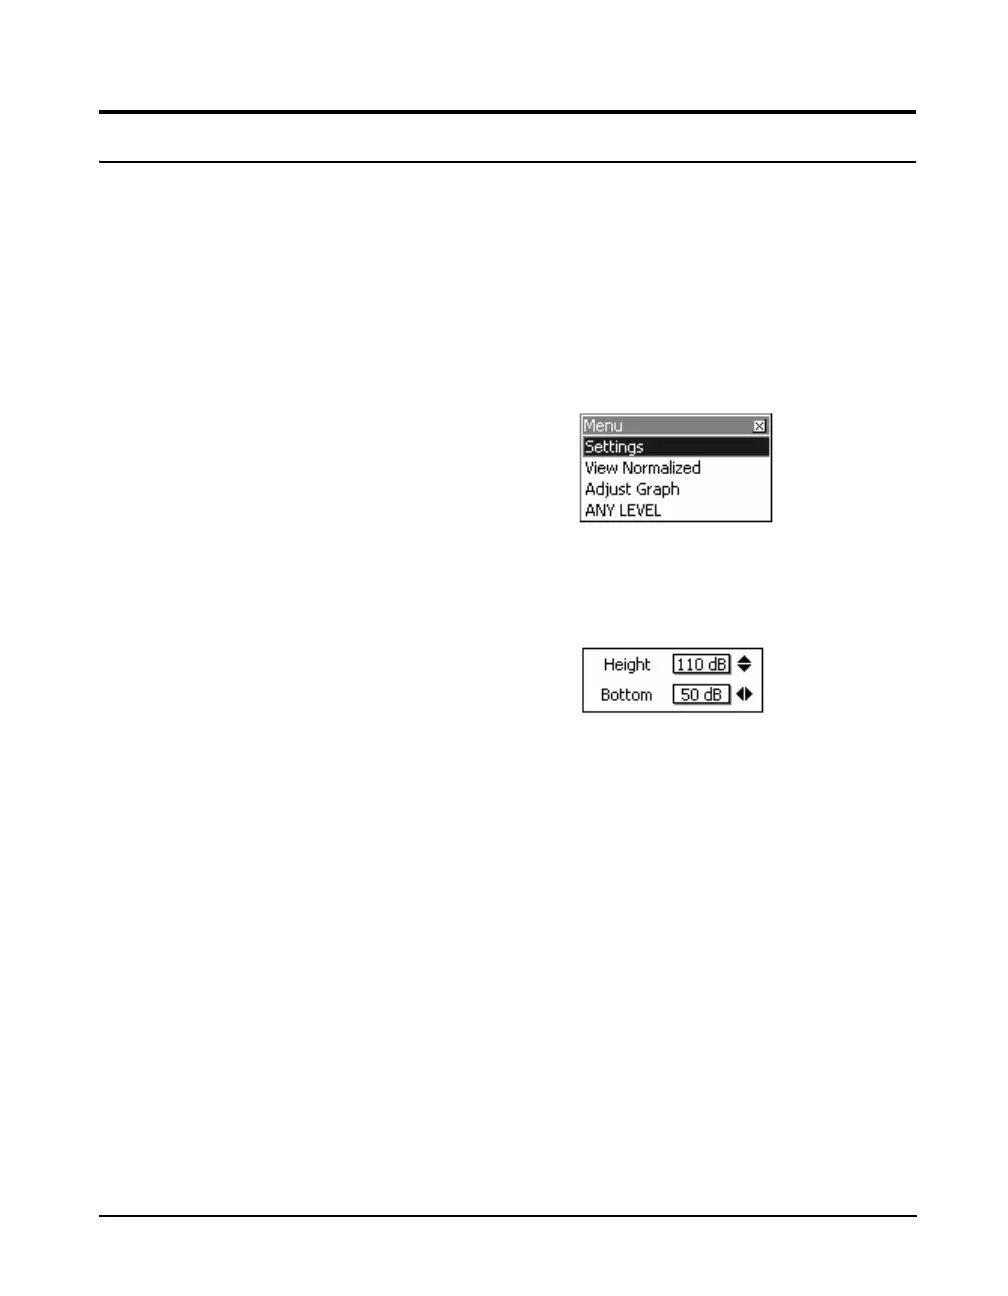
To change the scaling of any one of these graphs, press the
Menu softkey to obtain the display shown in FIGURE 5-31.
FIGURE 5-31 Menu
Use the 2 key to highlight Adjust Graph and press
5 to
obtain the Adjust Graph menu shown in FIGURE 5-32
FIGURE 5-32 Adjust Graph Menu
Note that when the OBA Range for
frequency spectra has been set to
Low, the value actually used for the
baseline of the display will be 30 dB
less than the number indicated for
Bottom in the Adjust Graph menu.
Use the 4 and 6 keys to change the baseline level and the
8 and 2 keys to adjust the height (range between the
baseline and the top of the display). Press
5 to implement
the change.
Once one or more graphic displays have had their scaling
changed, they will remain that way until changed again or
until the defaults settings are restored, as described in
"Format & Restore Defaults" on page 23-3.