14-10 Viewing and Analyzing Results Model 831 Manual
For normal and smooth spectra, consider specifying a tone
seek delta of 1 dB. For irregular spectra, or spectra with
short averaging times (as mentioned in C.2.2), specifying
values of 3 dB or 4 dB may provide better results.
If Tonality is enabled but
Measurement History disabled,
calculations are made using Overall
data.
Regression Range
Specify the Regression Range to determine masking noise,
as described in ISO 1996-2 C.4.4.
For more information on selecting a
regression range, see ISO 1996-2
section C.4.
The percentage selected reflects the + and - range of the
critical bandwidth to the right and left of the center
frequency. For example, selecting 75% results in a range
that is 75% to both the left and right of the central frequency.
Viewing and Analyzing Results
The Model 831 can measure FFT spectra with up to 6400
lines of resolution. Because of the limited resolution of the
display, every line displayed on the graph may contain more
than one measured value. The amplitude and frequency
displayed for the cursor position is determined by the
maximum value of the underlying FFT lines.
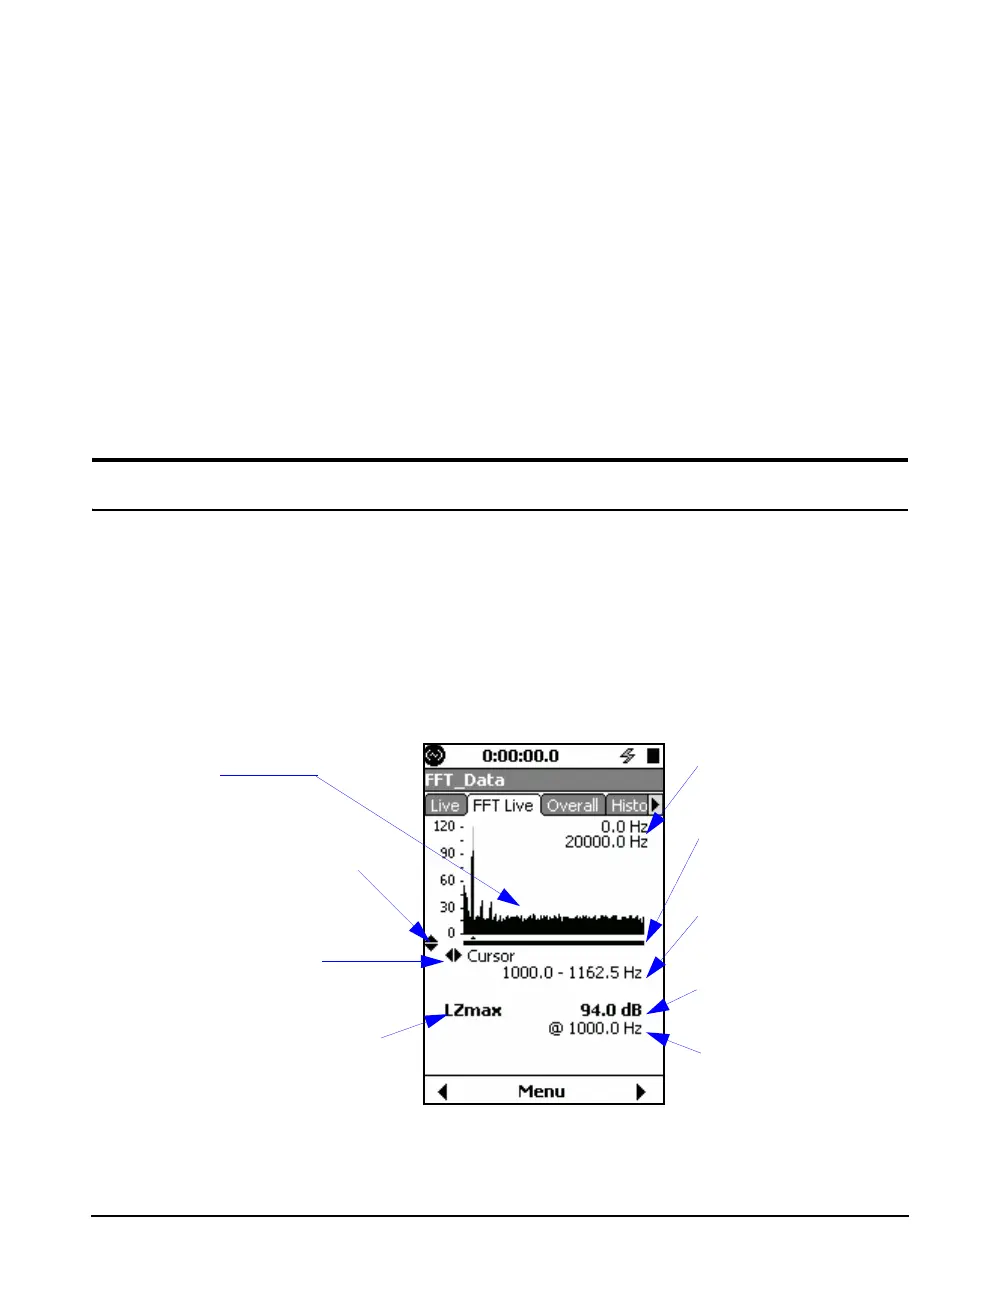
Figure 14-8 shows data on the FFT Live tab.
FIGURE 14-8 FFT Live
Indicates the
82
keys
control zooming
Indicates the 46
keys control the
cursor
Frequency range at
cursor
Indicates the level given is
the maximum of the lines at
the cursor
Frequency of the max
value at the cursor
Frequency range shown
on the display
Zoom level and relative
position indicator
Maximum value at cursor
Live Data