24-4 Statistical Metrics Measured Model 831 Manual
The symbol V is used to represent the user selected time
weighting (F, S or I)
Statistical Metrics Measured
Broadband Statistics
For setup of Ln Statistics, see “Ln
Tab” on page 4-7
Statistical sound level parameters are very useful for
characterizing time-varying sounds such as environmental
noise. A widely used parameter is Ln, which represents a
sound level which is exceeded n% of the measurement time.
For example, L
90
is often used as a measure of the
background noise since it is exceeded 90% of the time.
The Model 831 can calculate and display six different Ln
statistical parameters using the frequency weighting (A, C or
Z) and exponential averaging (Slow or Fast) selected when
setting it up for a sound level measurement. These six values
are user-selected over the range L
0.01
to L
99.99
.
The SLM Utility-G3 software permits
the distribution table from a saved
measurement to be exported to a
spreadsheet which could then be
utilized to calculate any possible
value of Ln over the range L
0.01
to
L
99.99.
To determine broadband statistics, the sound level is
sampled every 10 ms. into 0.1 dB wide amplitude classes
over a 199 dB span. The resulting table, from which all
values of Ln between L
0.01
to L
99.99
can be calculated, is
referred to as the distribution table. This distribution table is
saved whenever an overall measurement is saved.
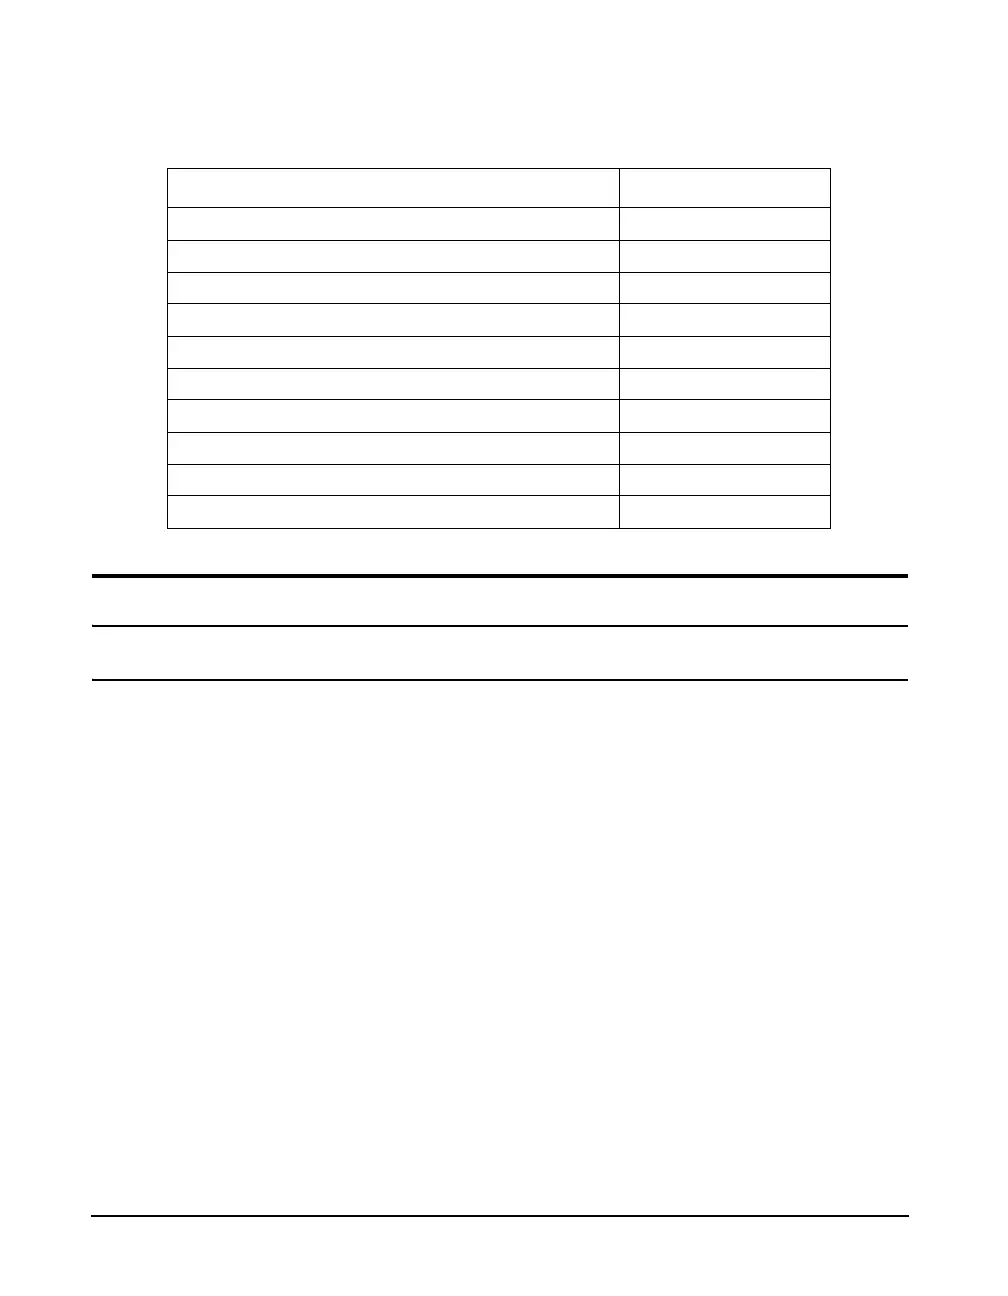
Metric Symbol
Sound Exposure Level, SEL L
XVE
Average Sound Level, Lavg L
Xavg
Time Weighted Average Level, TWA(x) TWA(8)
Noise Dose DOSE
Projected Noise Dose ProjDose
Daily Personal Noise Exposure, Lep,d LXep,8
Sound Exposure, E E
XV
Projected 8 Hour Sound Exposure E
XV8
Projected 40 Hour Sound Exposure E
XV40
SEA SEA
Table 24-2:Sound Exposure Metrics Measured