15-8 Viewing and Analyzing Results Model 831 Manual
Viewing and Analyzing Results
The data displays are the same regardless of the method used
for the measurement.
Following a measurement, the data can be viewed on the
RT-60 tab as follows:
• RT-60 Status
• RT-60 Spectra
• RT-60 Decay Curve
• Excitation Levels
• Quality Summary (two pages for 1/3 octave data)
• Quality Detail
• Accuracy Grade
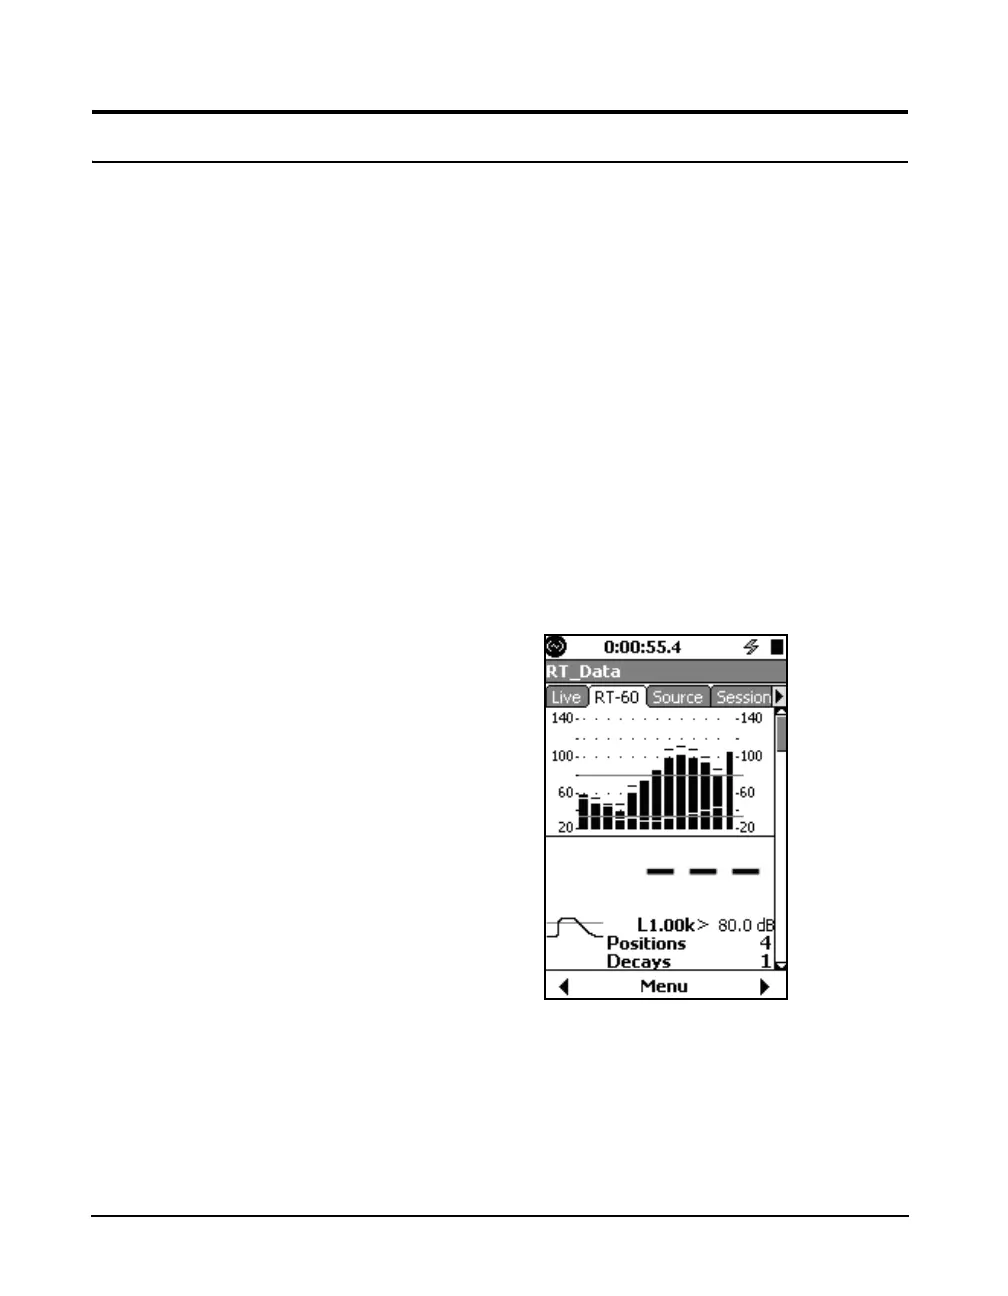
RT-60 Status
The RT-60 Status display shows the previously described
measurement states. After the measurement is complete, it
also shows the Lmax, Leq, and background level for each
frequency, as well as the Z-weighted Leq value.
FIGURE 15-13 RT-60 Status
 Loading...