Model 831 Manual Time History Display 11-9
Time History Display
Single Value Metrics
When the Model 831 is not equipped
with the optional firmware 831-OB3,
or if it is equipped with this option
but the measurement of 1/1 and 1/3
octave spectra has been set to Off in
the measurement setup, all measured
parameters will be single value
parameters.
In this section we discuss the time history graph which
appears for single value metrics such as sound levels and
non-acoustic parameters.
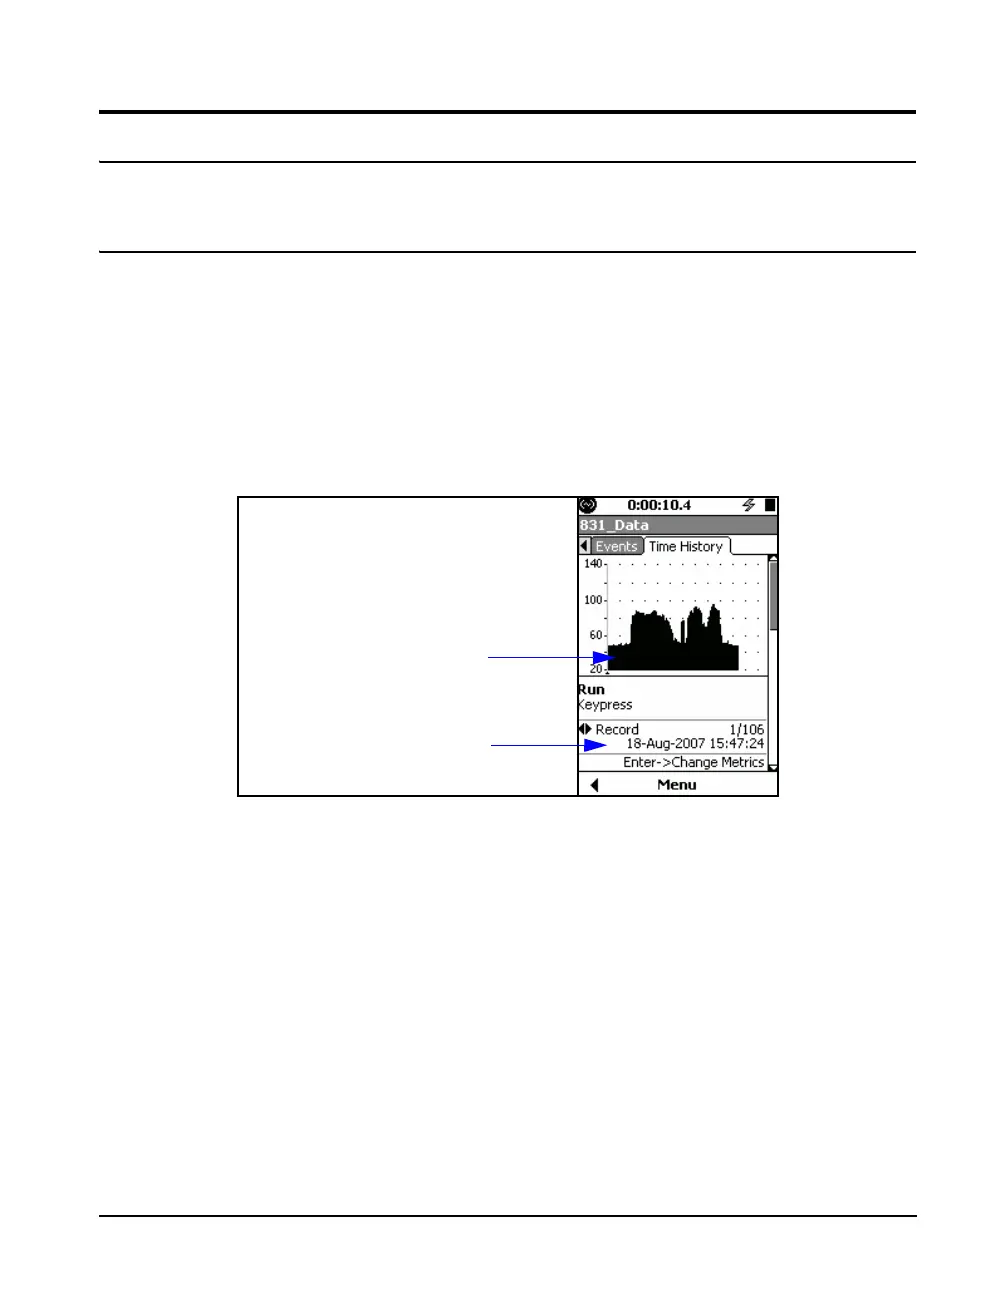
Time History data is displayed on the Time History tab of
the Data Display View as shown in Figure 11-6.
FIGURE 11-6 Time History Display: First Point; Keypress
Note that the graph scaling can be
modified as described in section
"Adjust Graph Scale” on page 5-29.
The initial graph on the Time History tab shows only 120
items from the time history at one time. There is no zoom in
or out feature. Note that the cursor is located to the left of the
graph and that there is no data digitally displayed. The label
Run indicates that the cursor is not yet on a time point of the
data set.
Date and time of
keypress beginning the
measurement
Time History Graph