5-12 Overall Tab Model 831 Manual
Overall Tab
The Overall tab includes multiple pages. Use the 8 or
2 keys to navigate up or down through pages on the tabs.
Note that from any of the displays
described in this section, the user
can also access the Any Level
Display, described in "Any Level
Display" on page 5-41.
This section addresses only those sections of the Overall tab
associated with basic sound level measurements. Other tabs
associated with data provided by optional firmware may also
appear. Although the 1/1 and 1/3 octave spectra require
optional firmware (831-OB3), we do include the display of
this data in this chapter.
Leq
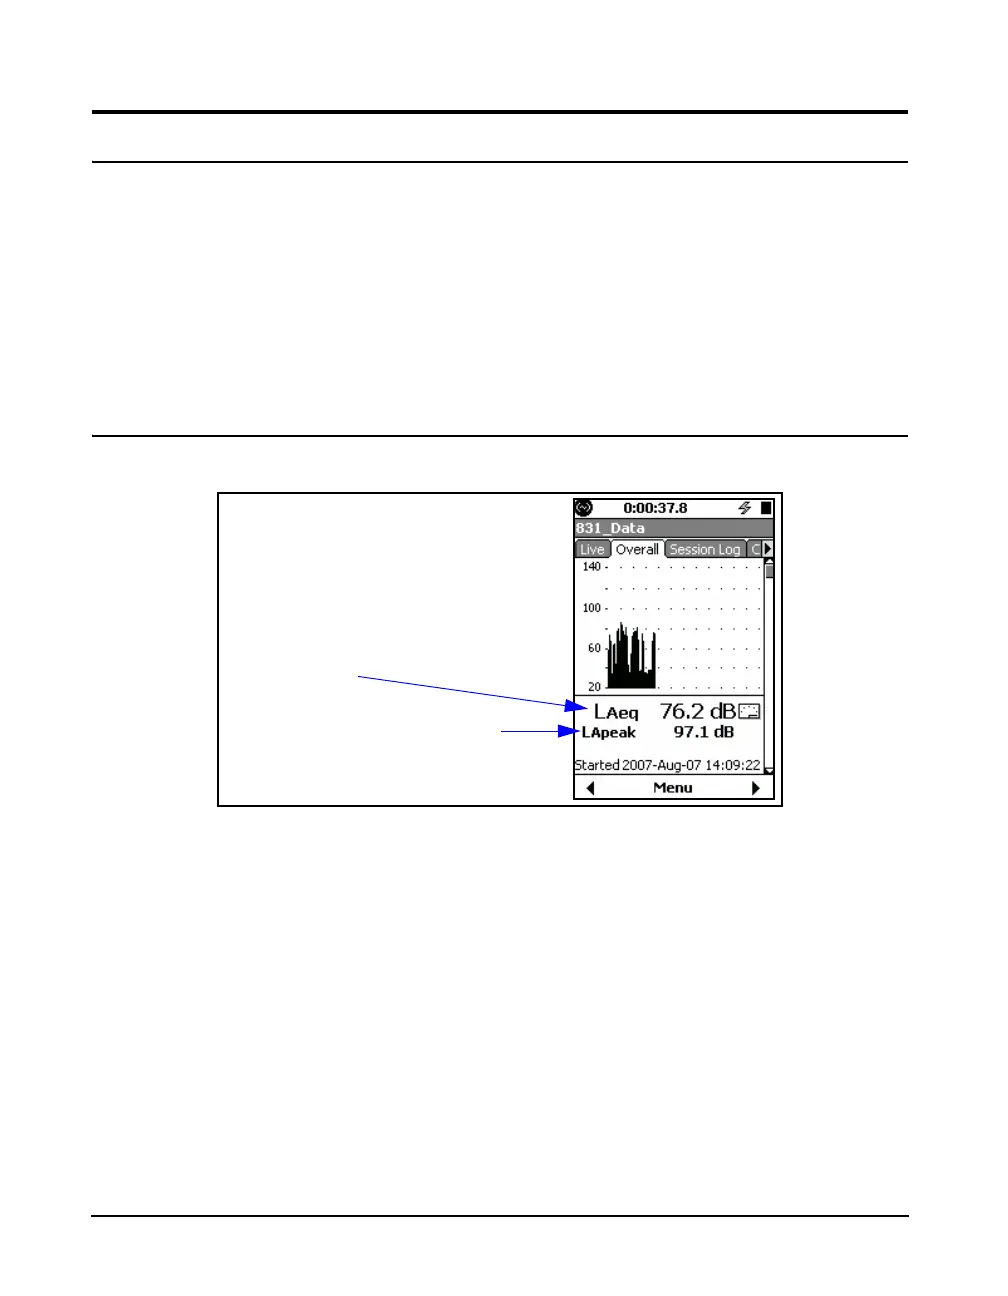
FIGURE 5-12 Overall Tab: Sound Level Profile
From this display the user can also
access the Any Level Display,
described in "Any Level Display" on
page 5-41.
The graph on this page depicts the profile of sound levels
measured throughout the overall measurement. The left side
of the graph is the very beginning and the right side is the
very end of the overall measurement. The run time for the
average calculation is shown at the top of the screen. The
graph display is updated approximately four times per
second.
The 1st numerical value displayed, L
Aeq
in this example, is
the equivalent sound level based on the run time of the
measurement. The frequency weighting and detector
correspond to those used in the setup.
User-selected SLM parameter
Leq value using frequency
weighting and detector from
setup