Model 831 Manual Data Display 5-1
CHAPTER
5
Data Display
In the previous chapter, the setup procedure for a basic
sound level measurement was described. This chapter
describes how this data would be displayed during or
following a measurement sequence.
The Model 831 can measure many additional sound
parameters simultaneously with these basic sound
measurements as described in other sections of this
manual. It can also measure a variety of non-acoustical
parameters, as described in Chapter 19 "Non-Acoustical
Inputs” on page 19-1 and the section "Non-Acoustical
Metrics" on page 11-3.
Data Labels
The labels for sound metrics in the Model 831 are
designated by international standards. For many displayed
values, the frequency and time weighting are indicated in the
name of the metric. Example: L
AS
is the A-weighted sound
pressure level measured using the Slow detector. Sound
pressure level is often referred to as SPL.
Tabbed Structure
Only a few of these horizontally
arranged tabs (three in Figure 5-1)
can be seen at one time. To see those
off-screen to the right use the Right
Softkey beneath the display. To scroll
back to the left, use the Left Softkey
beneath the display.
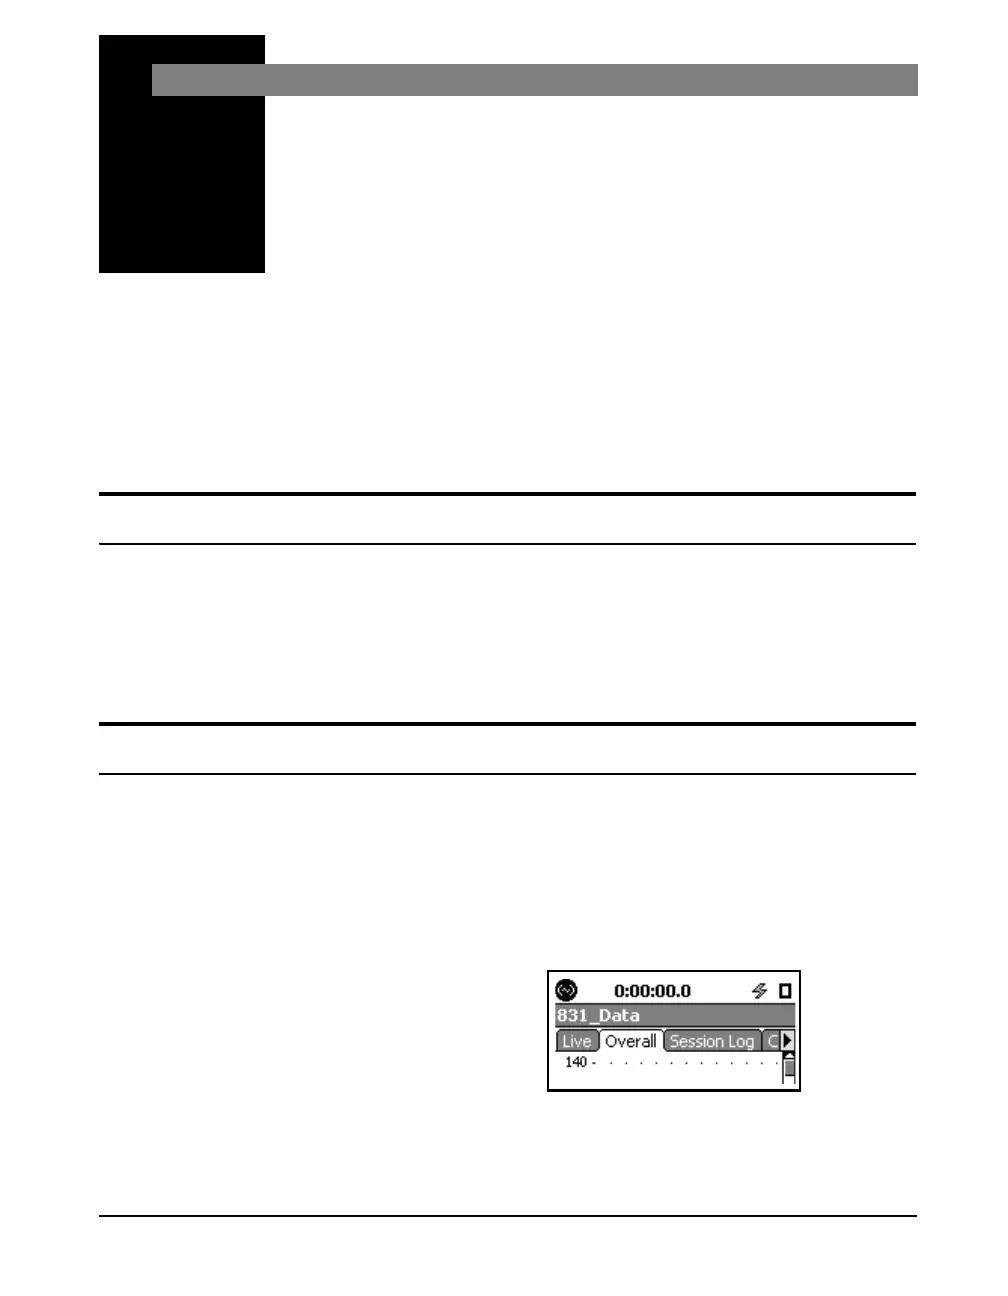
Measured data are displayed using a number of tabs
arranged horizontally across the screen, as shown in Figure
5-1. Depending on the firmware options loaded in the Model
831, there may be as many as seven different data display
tabs each identified by a title at the top. Use the Right and
Left Softkeys to navigate between tabs.
FIGURE 5-1 Tabbed Structure