5-30 View Spectrum Normalized Model 831 Manual
View Spectrum Normalized
Note that the Live Spectrum will
continue to change in time following
the normalization, whereas the
Reference spectrum will remain the
same.
The default 1/1 and 1/3 octave spectrum displays present the
amplitude versus frequency of the measured spectrum as
shown in FIGURE 5-5 and FIGURE 5-6.
The View Normalized function permits the display of the
difference between two spectra by subtracting a user-
selected reference spectrum from the measured spectrum.
This function can be used with both 1/1 and 1/3 octave
spectra, although the measured spectrum and the reference
spectrum must have the same bandwidth; 1/1 or 1/3 octave.
A and C frequency weighting curves can also be used for the
reference, as described in "Normalizing using Frequency
Weighting" on page 5-34.
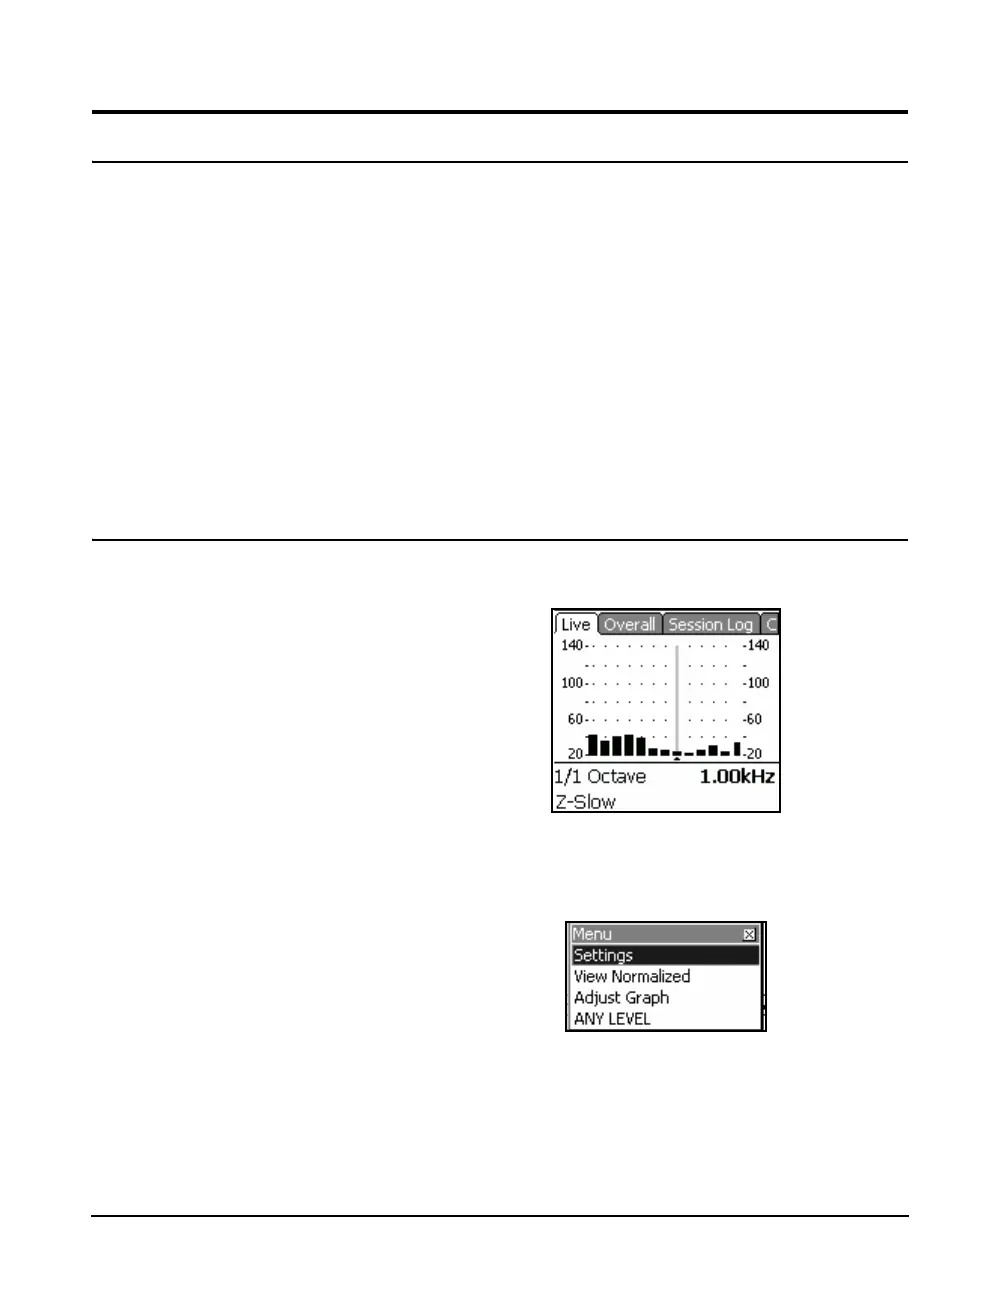
Live Display
A standard spectrum displayed on the Live tab appears as
shown in FIGURE 5-33.
FIGURE 5-33 Standard Live Spectrum Display
To access the View Normalized display, press the center
software Menu to display the menu shown in FIGURE 5-33.
FIGURE 5-34 Menu