Model 831 Manual Live Tab 5-5
1/1 Octave Band Analyzer (Optional)
The 1/1 Octave Band Analyzer
display appears only when the
instrument is loaded with the
optional 831-OB3 firmware.
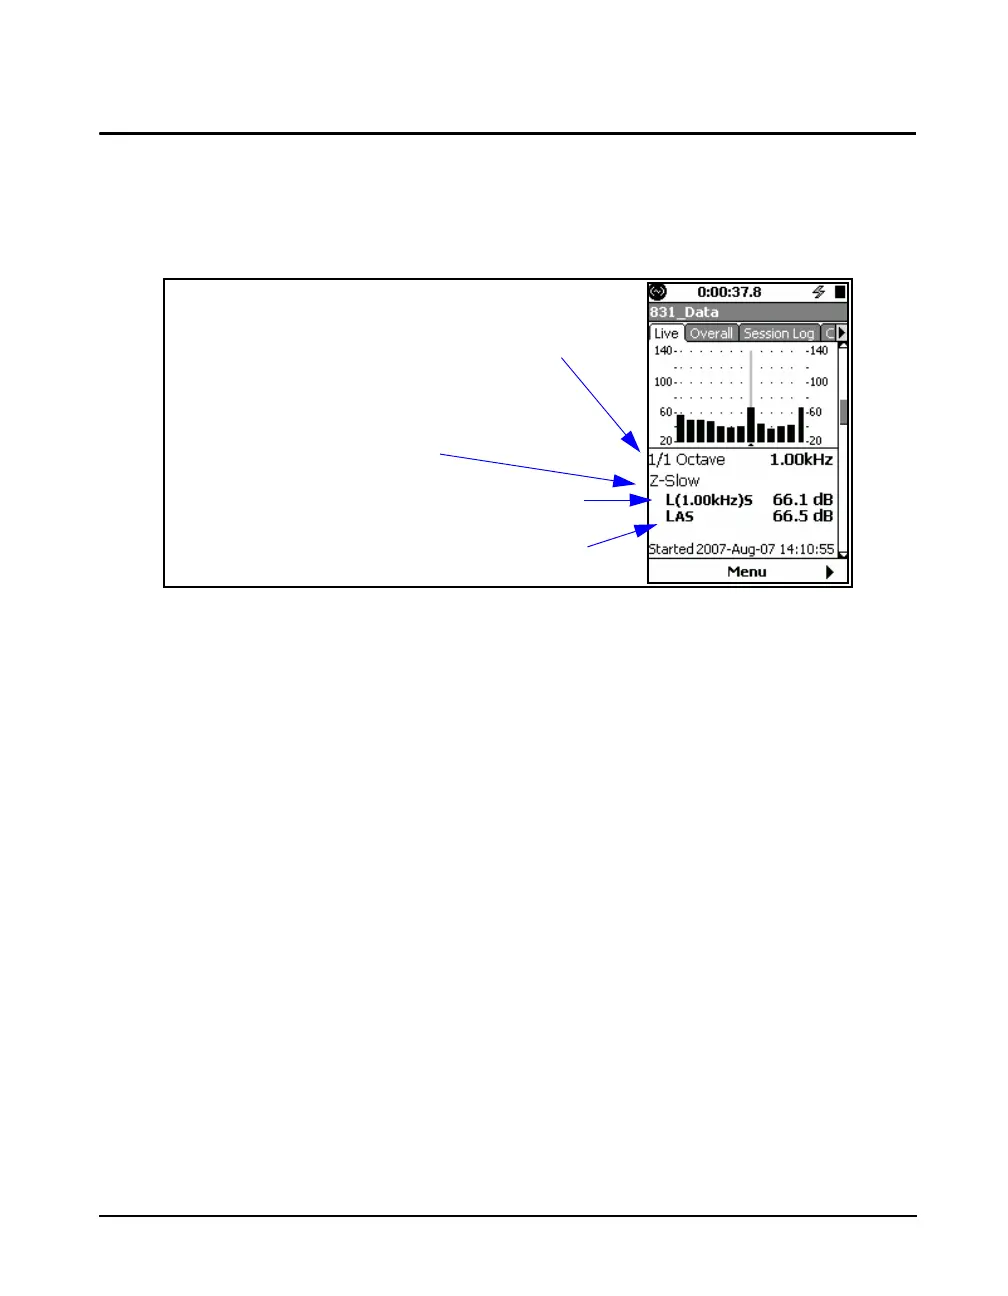
FIGURE 5-5 Live Tab: 1/1 Octave Spectrum
The 1/1 Octave page shows a bar graph of sound level in 1/1
octave frequency bands. The right most bar on the graph is
the L
AS
.
Note that the spectrum frequency
weighting is selected independently
from that of the sound level
measurement, as described in "OBA
Frequency Weighting" on page 4-7.
The detector is the same as that of
the sound level measurement.
It is indicated beneath the graph that it is in 1/1 octave
bands. On the graph, the vertical bar for the selected octave
band is highlighted. The frequency of the octave band for
which data is being displayed, the sound pressure level
frequency weighting (A weight) and the detector response
(Slow) are also shown.
Note that the graph scaling can be
modified as described in section
"Adjust Graph Scale" on page 5-29
and the display normalized to
another spectrum, as described in
section "View Spectrum Normalized"
on page 5-30.
L
(1.00kHz)S
indicates the sound level in the 1 kHz band with a
Slow detector setting.
L
AS
is the A weighted, Slow detector response sound level.
Frequency weighting and
Detector for Sound Level
Measurement
Frequency Spectrum Bandwidth
Frequency Band Level at Cursor Position
Sound Pressure Level, Frequency Weighting
and Averaging as Indicted by Subscripts