Model 831 Manual Any Level Display 5-41
Normalizing using User-Defined Spectrum
The creation and use of user-defined reference spectra for
the Overall Display are the same as for the Live Display,
described in the section "Normalizing using User-Defined
Spectrum" on page 5-35.
Graph Relative
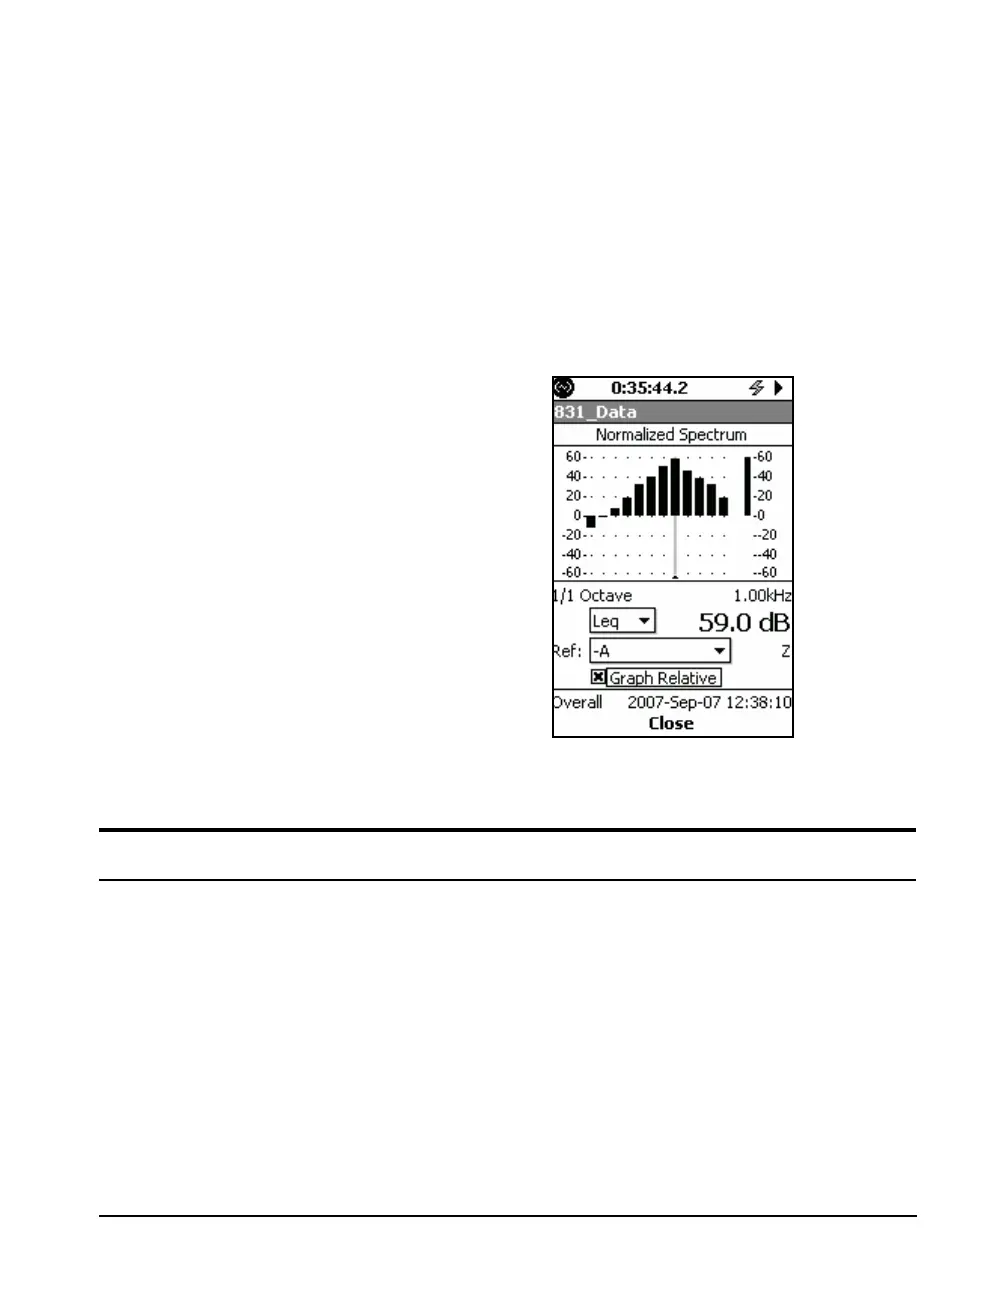
When the Graph Relative has been enabled by placing a
check in the Graph Relative check box, the graph is
presented using a plus and minus about a vertically centered
zero Y axis, as shown in FIGURE 5-49.
FIGURE 5-49 Normalized Spectrum: Graphed
Relative
Any Level Display
In the displays shown in the above sections, the sound level
values that appear are for user-selected values of frequency
weighting, detector and peak weighting. However, the
Model 831 is simultaneously calculating sound level values
for all possible selections of frequency weighting (A, C and
Z), detector (Slow, Fast and Impulse) and peak weighting
(A, C and Z).