Model 831 Manual View Spectrum Normalized 5-35
Note that the scale in FIGURE 5-39 was adjusted as
described in "Adjusting Graph Display" on page 5-34 in
order to display the low level and negative amplitudes.
Normalizing using User-Defined Spectrum
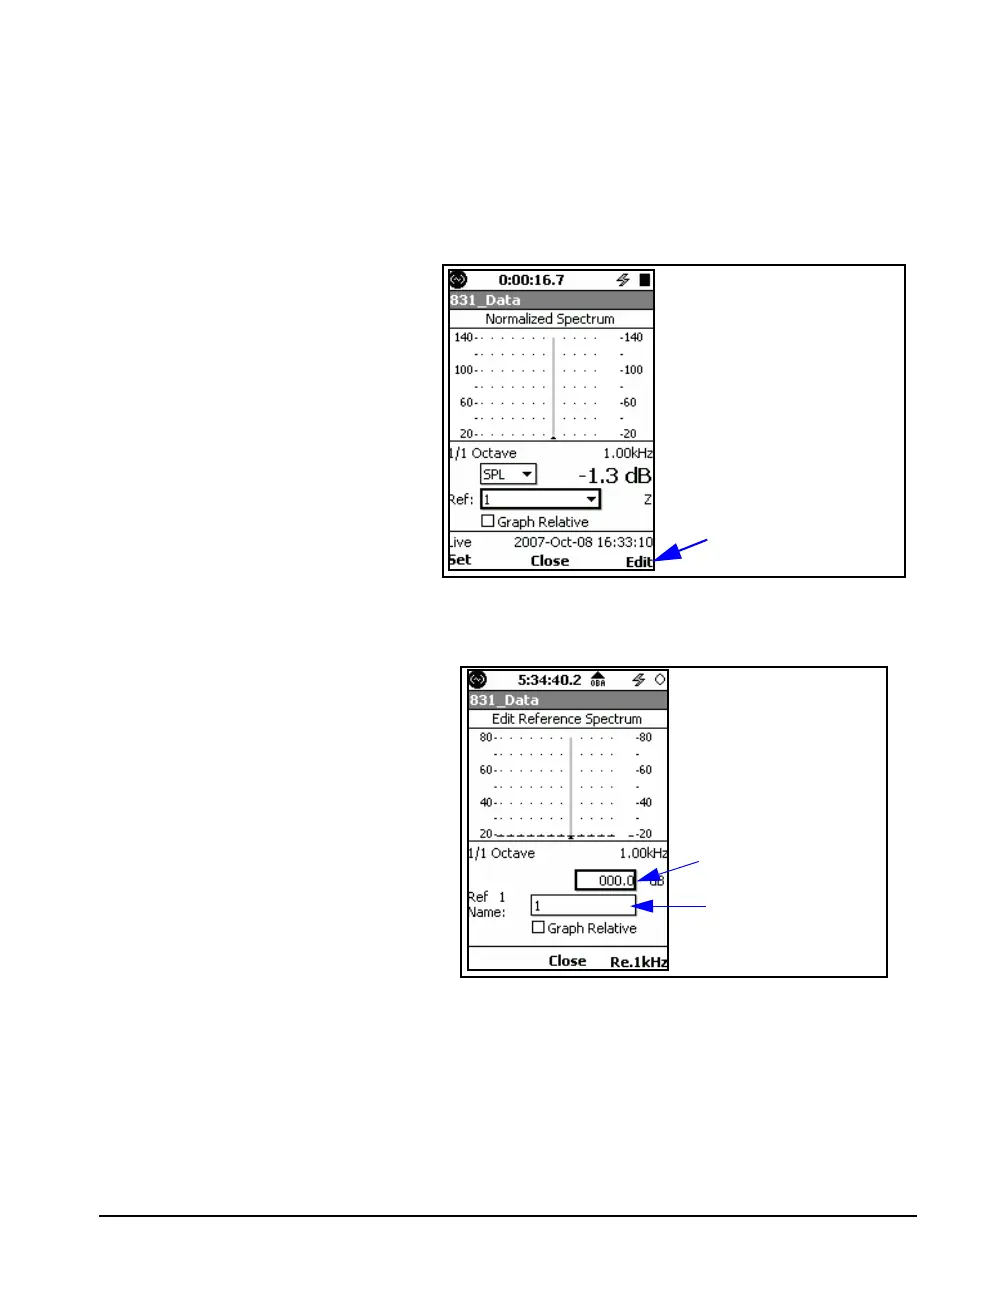
The user can also define their own reference spectrum by
pressing the Edit softkey as shown in FIGURE 5-40.
FIGURE 5-40 Edit Softkey for User-Defined
Reference Spectrum
This will produce the display shown in FIGURE 5-41.
FIGURE 5-41 Creating User-Defined Reference
Spectrum
Creating a User-Defined Reference Spectrum
The user-defined spectrum is created one band at a time. Use
the 4 and 6 keys to move the cursor to the frequency band
whose amplitude is to be changed, highlight the input
amplitude field shown FIGURE 5-41. Press
5, use the 4,
Edit User-Defined
Reference Spectrum
Input Amplitude
Name Reference
Spectrum