5-34 View Spectrum Normalized Model 831 Manual
Adjusting Graph Display
Because some of the frequency components in the
normalized view may be small or negative, the Adjust Graph
function described in "Adjust Graph Scale" on page 5-29
can be used to obtain a graph having both positive and
negative amplitude values. The Adjust Graph function can
only be implemented from the source graph, so in this case
return to the Live spectrum display, adjust the graph as
desired, then return to the normalized view for which the
same adjustment will be in effect.
Normalizing using Frequency Weighting
When normalizing using positively signed A and C, this
normalization subtracts a spectrum which is the inverse of
the spectrum representing the corrections. Thus, by selecting
A (or C), this will negate the frequency weighting effect on
spectra which had originally been measured using A (or C)
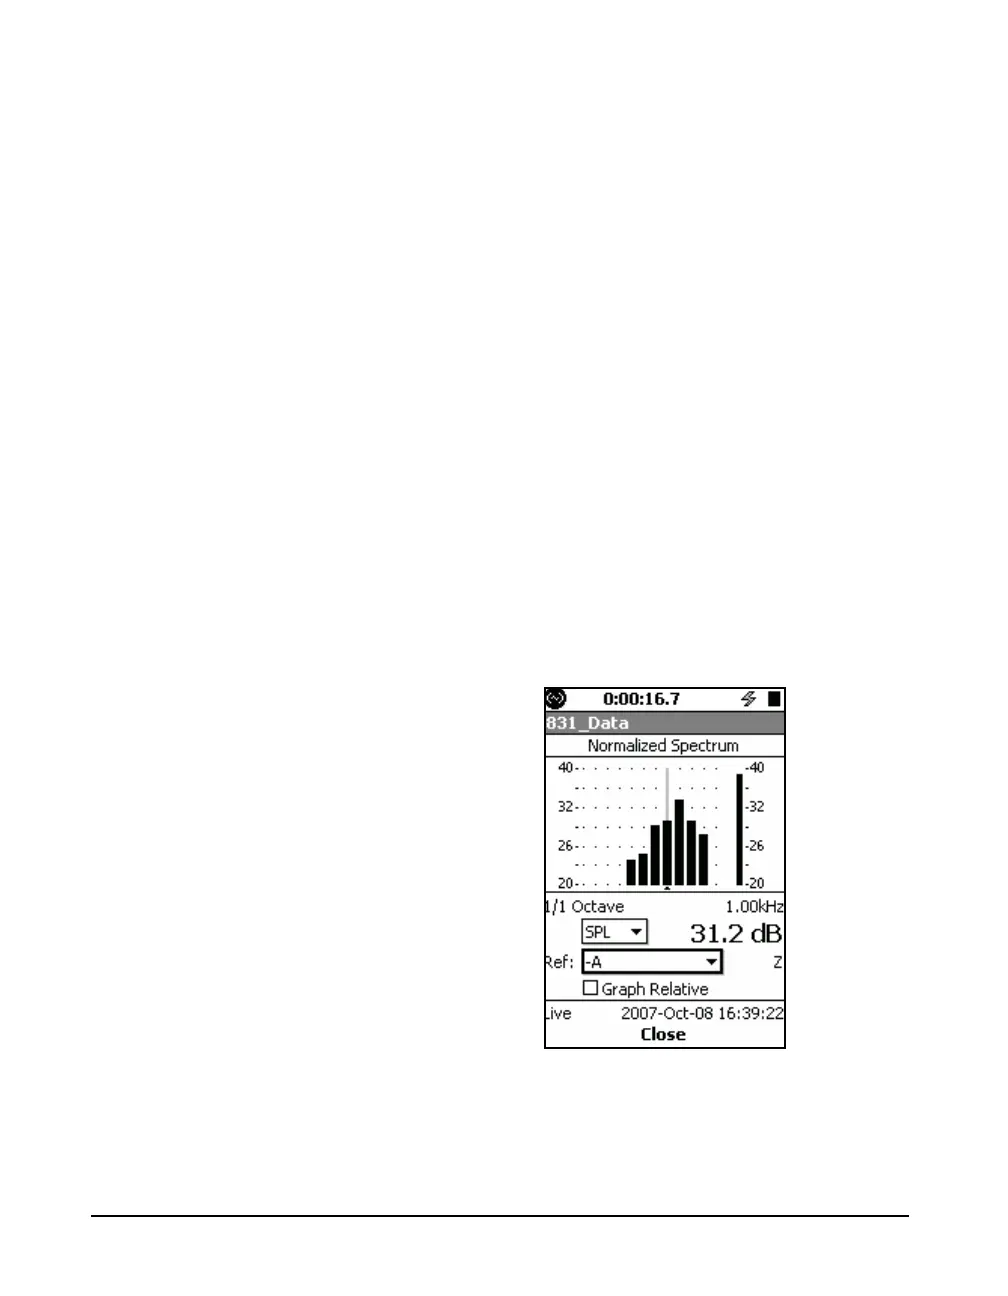
frequency weighting. To obtain an A (or C) weighted
spectrum when the measurement had been made without
frequency weighting, select -A (or -C) for the reference. For
example, when the measured spectrum is similar to FIGURE
5-33, by selecting -A the normalized view displays an A-
weighted version of this spectrum, as shown in FIGURE 5-
39.
FIGURE 5-39 Spectrum From