Model 831 Manual View Spectrum Normalized 5-33
Normalized Using The Measured Spectrum
When the displayed spectrum has been normalized using the
measured spectrum, and the sound being measured is not
much different than it was previously, the display will
resemble FIGURE 5-37.
FIGURE 5-37 Normalized Spectrum Display:
Similar Sound Field
The display scaling can be adjusted
to show lower level and negative
values as described in "Adjusting
Graph Display" on page 5-34.
We can see that at 1 kHz, the cursor position, the measured
level is 1.3 dB above that of the reference spectrum, but this
is not visible on this graph because the bottom of the scale is
~ 20 dB.
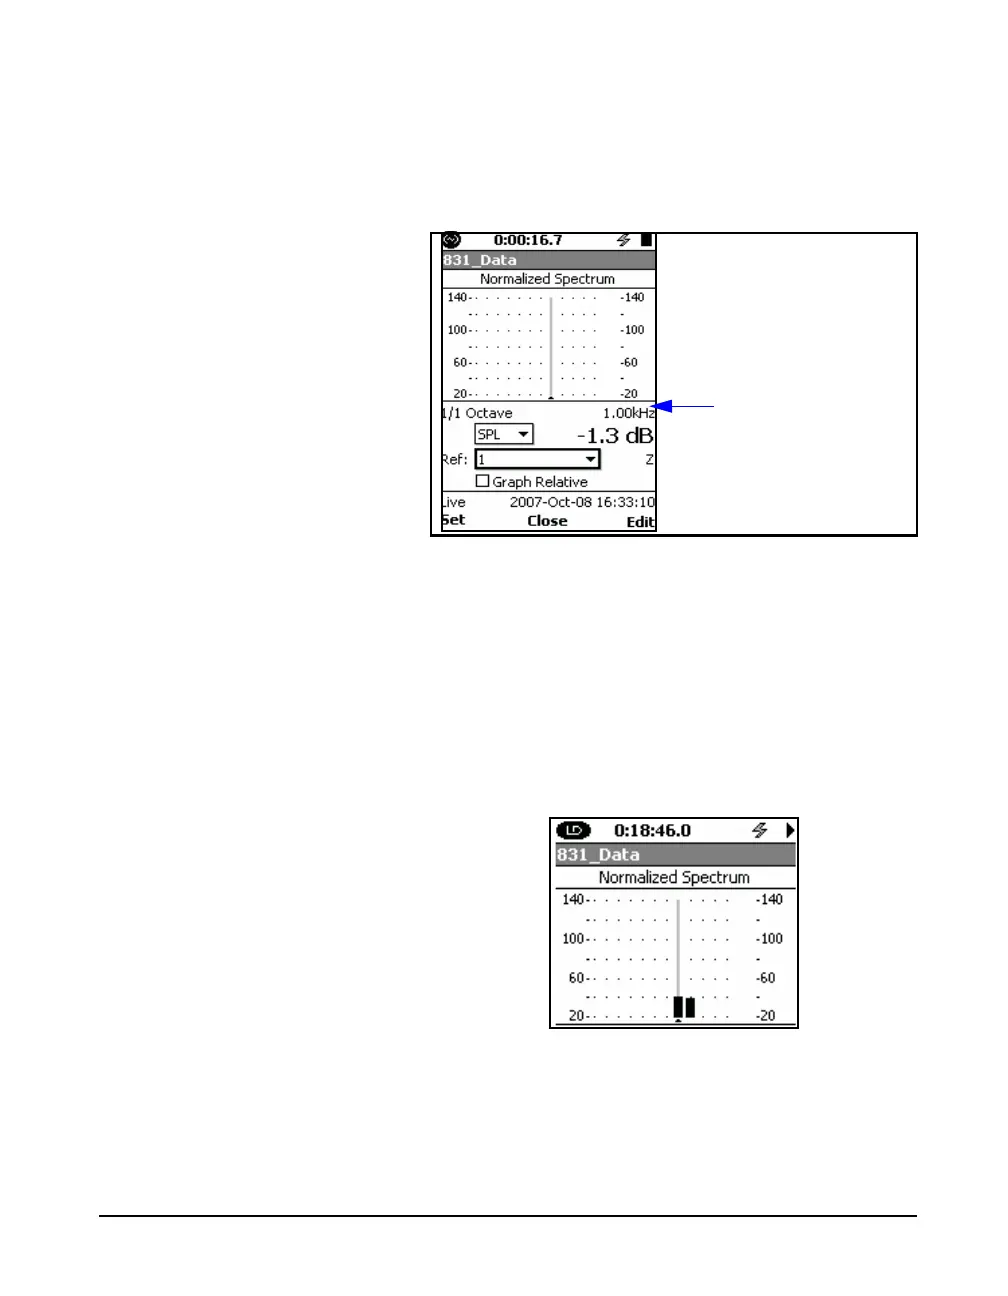
If the display were more like that shown in FIGURE 5-38,
this would indicate that the levels in the 1 kHz and 2 kHz
bands were approximately 42 dB higher than for the
reference spectrum.
FIGURE 5-38 Normalized Spectrum Display:
Higher Levels at 1 kHz and 2 kHz
Frequency and Level
at Cursor Position