Model 831 Manual Event History Display 13-21
By-Time Event Spectral Time History
With all possibilities included, the seventh display would be
a By-Time Event Spectral Time History for the displayed
event, as shown in FIGURE 13-19.
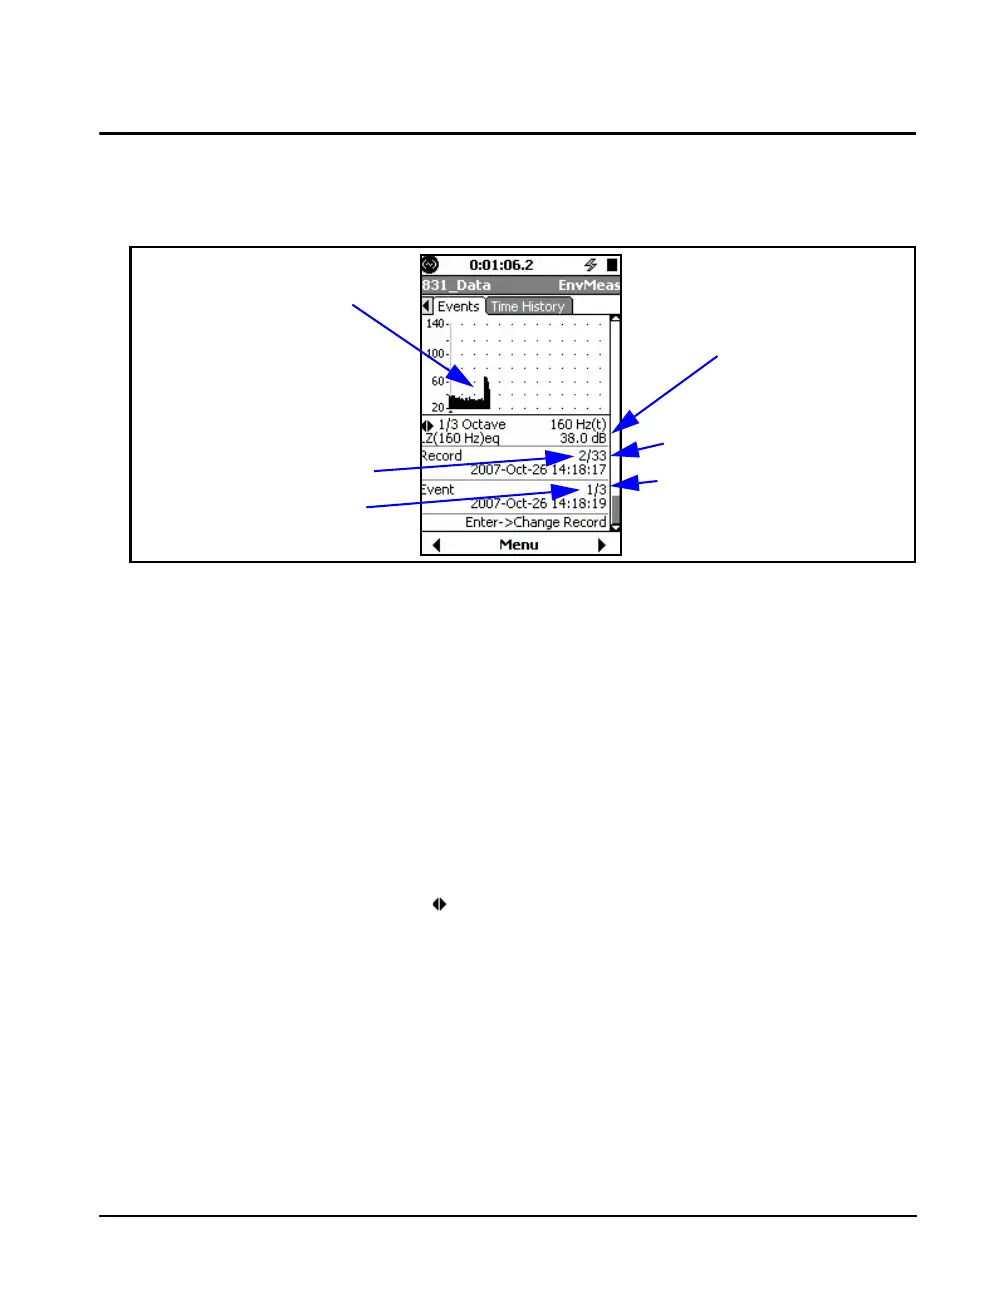
FIGURE 13-21 By-Time Event Spectral Time History Display, Section 7
Left/Right Arrow Keys
For the display shown in FIGURE 13-21, the 4 and 6 arrow
keys have three roles as listed below. Use the
5 key to step
through them:
• Change Frequency
• Change Record
• Change Event
At any time, the role of the left and right arrow keys is
indicated by the left/right arrow icon
and the action of the
5 key to change their role is indicated
in the lower portions of the display, as shown in FIGURE
13-15.
Frequency of Time History
Graph being Displayed and
Leq value for that Time
History.
Number of Time History
Records Measured
Event Being Displayed
Number of Events
Measured
Record Being Displayed
Time History Graph of
Selected Frequency Band