Model 831 Manual Viewing and Analyzing Results 15-9
RT-60 Spectra
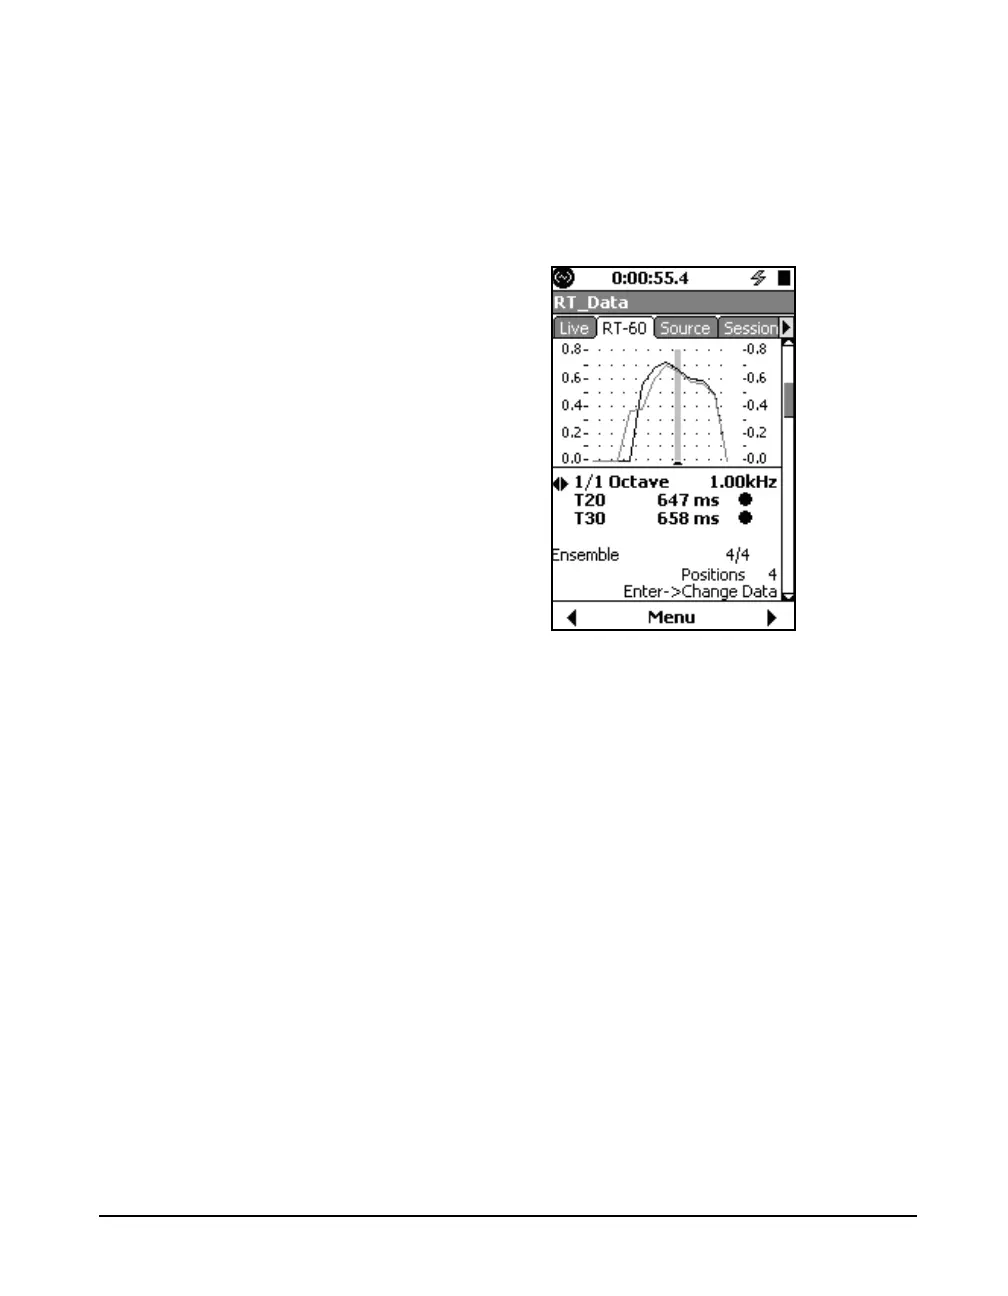
The RT-60 Spectra display shows a graph of the
reverberation times for each frequency of the ensemble
average or an individual decay. Both T30 (black line) and
T20 (grey line) data are displayed.
FIGURE 15-14 RT-60 Spectra
The navigation described here
applies to most of the pages on the
RT-60 tab.
When viewing information for the ensemble average,
pressing
5 toggles the role of the left/right arrow keys
between changing ensemble/decay and changing frequency.
A prompt near the bottom of the
display (Enter -> Change data in
Figure 15-14) indicated where the
focus of the left/right arrows will go
when
5
is pressed.
When viewing information for an individual decay, pressing
5 toggles the role of the left/right arrow keys between
changing ensemble/decay, frequency, and decay number.
See FIGURE 15-5.