5-16 Overall Tab Model 831 Manual
1/1 Octave Band Analyzer (Optional)
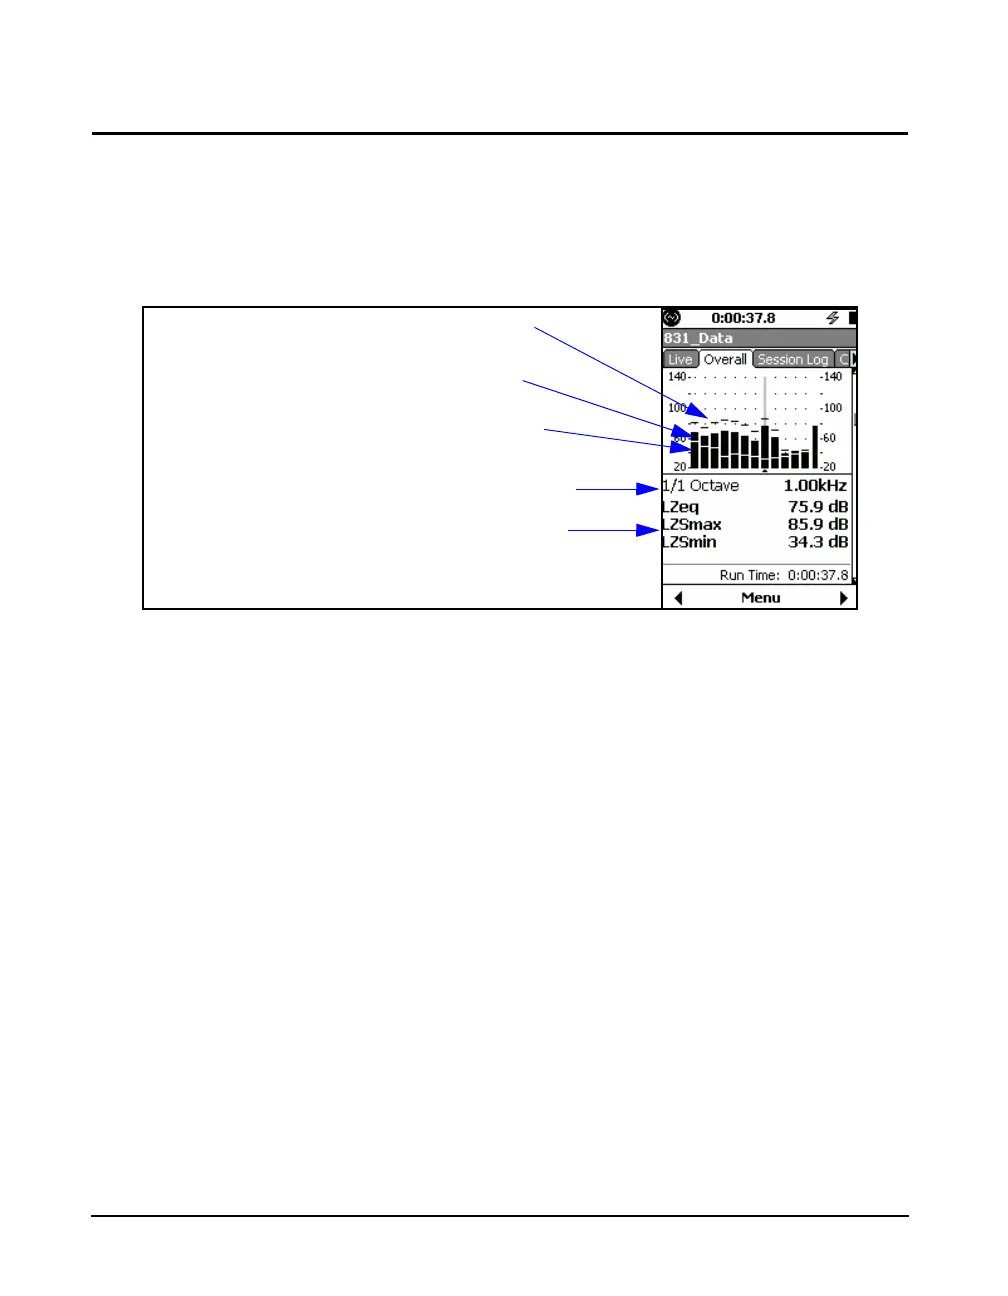
The 1/1 Octave Band Analyzer
display appears only when the
optional firmware 831-OB3 has been
enabled and this measurement mode
has been selected in the setup.
FIGURE 5-16 Overall Tab: 1/1 Octave Spectrum
Note that the graph scaling can be
modified as described in section
"Adjust Graph Scale" on page 5-29
and the display normalized to
another spectrum, as described in
section "View Spectrum Normalized"
on page 5-30.
The data displayed in section four shows Leq, Lmax and
Lmin sound levels in 1/1 octave frequency bands calculated
for the duration of the measurement. The right most bar on
the graph is the sum of the Leq values for the total spectrum.
The bar for the displayed frequency band is highlighted. The
highlight can be moved using the 4 and 6 keys.
Leq
L
eq
is the energy average sound level of the highlighted
frequency band for the duration of the measurement.
Lmin
L
min
is the minimum sound level of the highlighted
frequency band for the duration of the measurement. Since
individual frequency bands may reach their minimum levels
at different times, this spectrum might be one which never
occurred at any instant during the measurement period.
Frequency Spectrum Bandwidth
Spectral Measurements: Leq, Lmax and Lmin,
with frequency weighting and averaging
indicated
Lmax Values
Leq Values
Lmin Values