8 - 6 Operator’s Manual
8 Contrast Imaging
This function provides a motion compensated ROI as precise time-intensity information can be
acquired using active tracking. It can enhance the calculation accuracy as reducing the impact
of probe or patient respiratory movement.
6. If necessary, tap [Fit Curve] to perform curve fitting on the time-intensity curve, where color of
the fitted curve is consistent with color of the current ROI curve.
The system can calculate characteristic parameters according to curve fitting formula and data,
display fit curve for time-intensity curve, and perform data analysis on time-intensity curve for
data table.
– Tap [Raw Curve] to hide/display raw curve, when the button is highlighted in green, raw
curve is displayed.
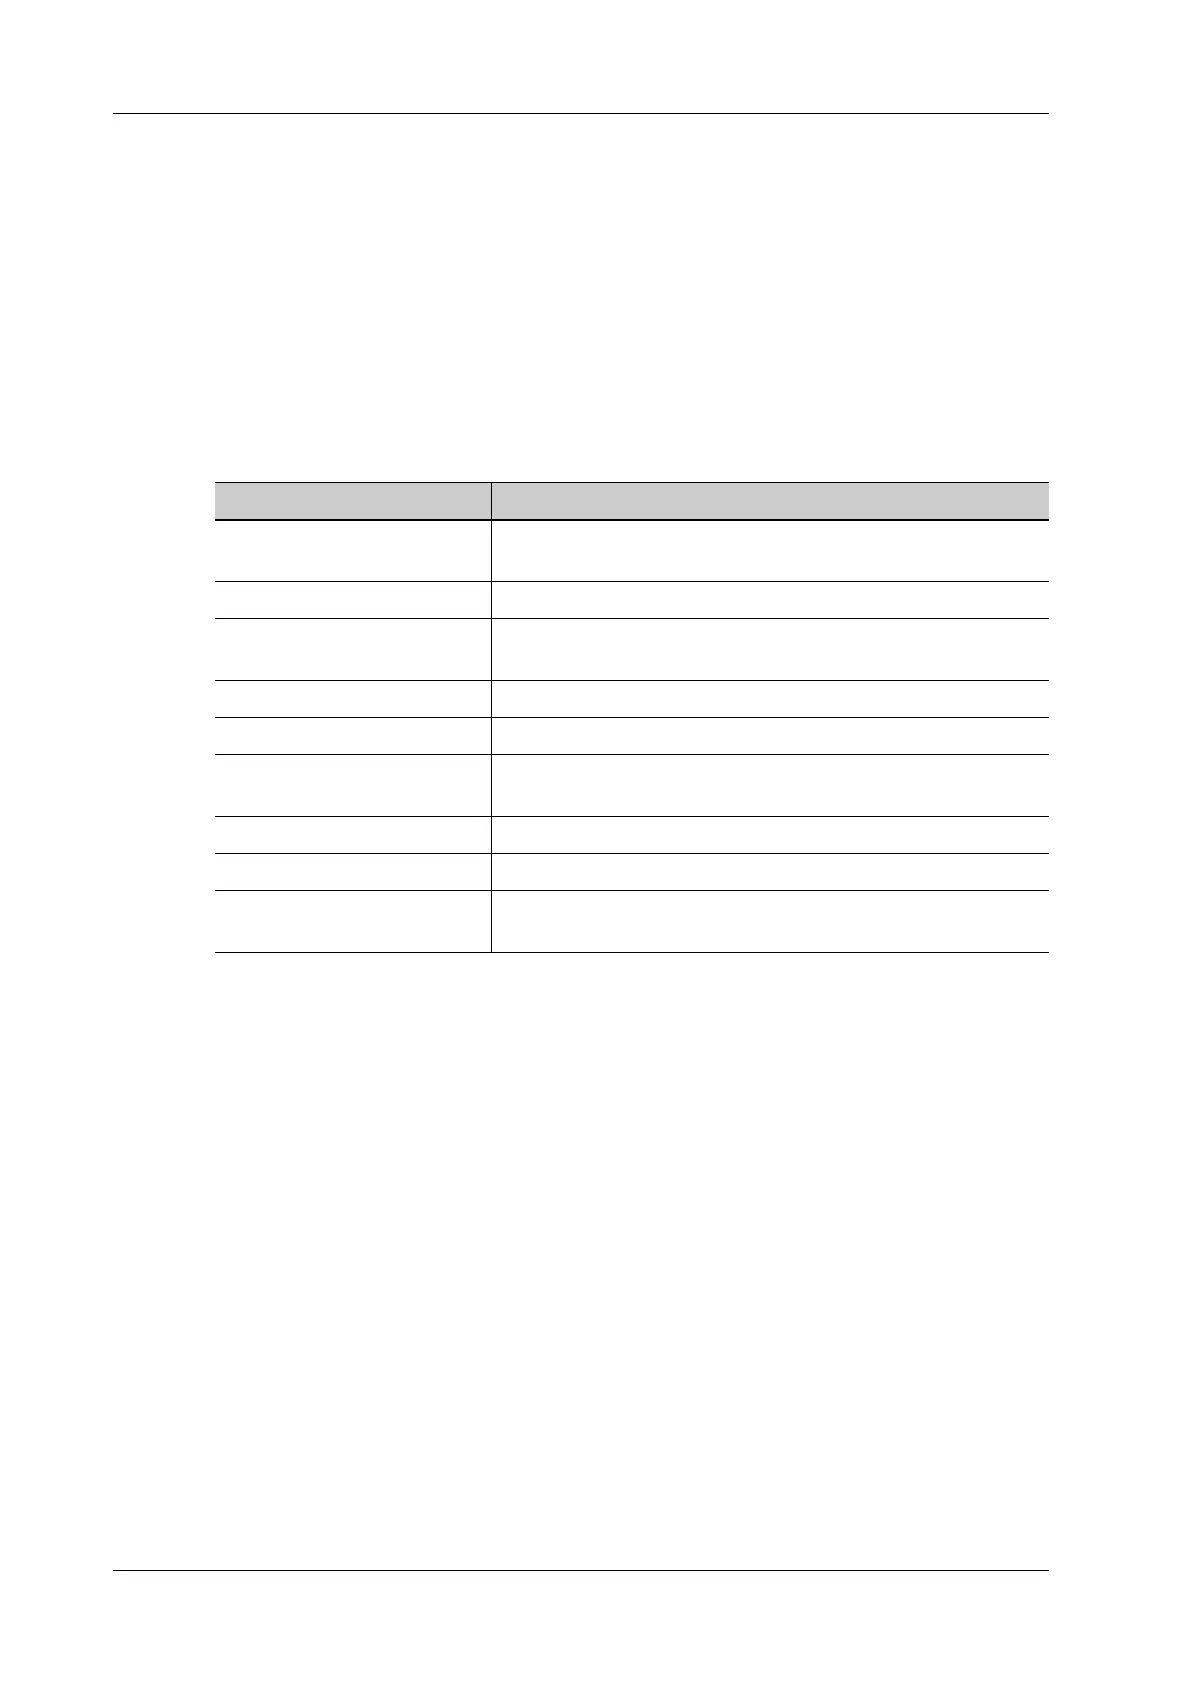
– Tap [Table display] to check parameters:
You can set range for the fit curve. After the range is set, the system displays fit curve within
the range only. Tap and drag the time-intensity curve to move the frame marker position.
a. Set starting point of the fit curve: select the starting time and tap [Set Fit Start].
b. Set end of the fit curve: select the end time and tap [Set Fit End].
7. Use [X Scale] on the touch screen to choose different value, so that the X scale display manner
will be changed.
This function can be used to track detailed tissue information.
8. Save the curved image, export the data and do parameter analysis.
a. Tap [Export] on the touch screen.
b. Select the drive and enter the file name in the displayed window.
c. Select [OK] to save the data and return to the QA Analysis screen.
All displayed ROI traces are saved in the exported file.
The parameters are included in the trace file if the user has fixed a ROI.
After the exporting is succeeded, a .BMP format image is displayed in the thumbnail area
of the screen.
Only data from the user selected image range is included in the exported trace file.
9. Tap [Exit] to exit Contrast QA.
Item Description
GOF (Goodness of Fit) Calculate the fit degree of the curve; range: 0-1, where 1 means
the fit curve fits the raw curve perfectly.
BI (Base Intensity) Basic intensity of no contrast agent perfusion status.
AT (Arrival Time) Time point where contrast intensity appears, generally, the actual
time value is 110% higher than the base intensity.
TTP (Time To Peak) Time when the contrast intensity reaches peak value.
PI (Peak Intensity) Contrast peak intensity.
AS (Ascending Slope) Ascending slope of contrast, the slope between the start point of
lesion perfusion to the peak.
DT/2 Time when the intensity is half the value of the peak intensity.
DS (Descending Slope) Descending slope of the curve.
AUC (Area Under Curve) To calculate the area under the time-intensity curves during
contrast.