The bar graph shows three areas:
A
dead load (can be changed by calibration)
B
Maximum capacity E
max
(max. capacity of load cell) including dead load (load cell,
cannot be changed)
C
Max. load including dead load (load cell, cannot be changed)
The colors have the following meanings:
Red
Weight value is above maximum load (overload) or below -¼d
Green
Weight value is within tolerances
Orange
Weight value is above maximum capacity E
max
(max. capacity of load cell)
[No ID]
The Serial number is hidden.
[Show ID]
The Serial number is visible.
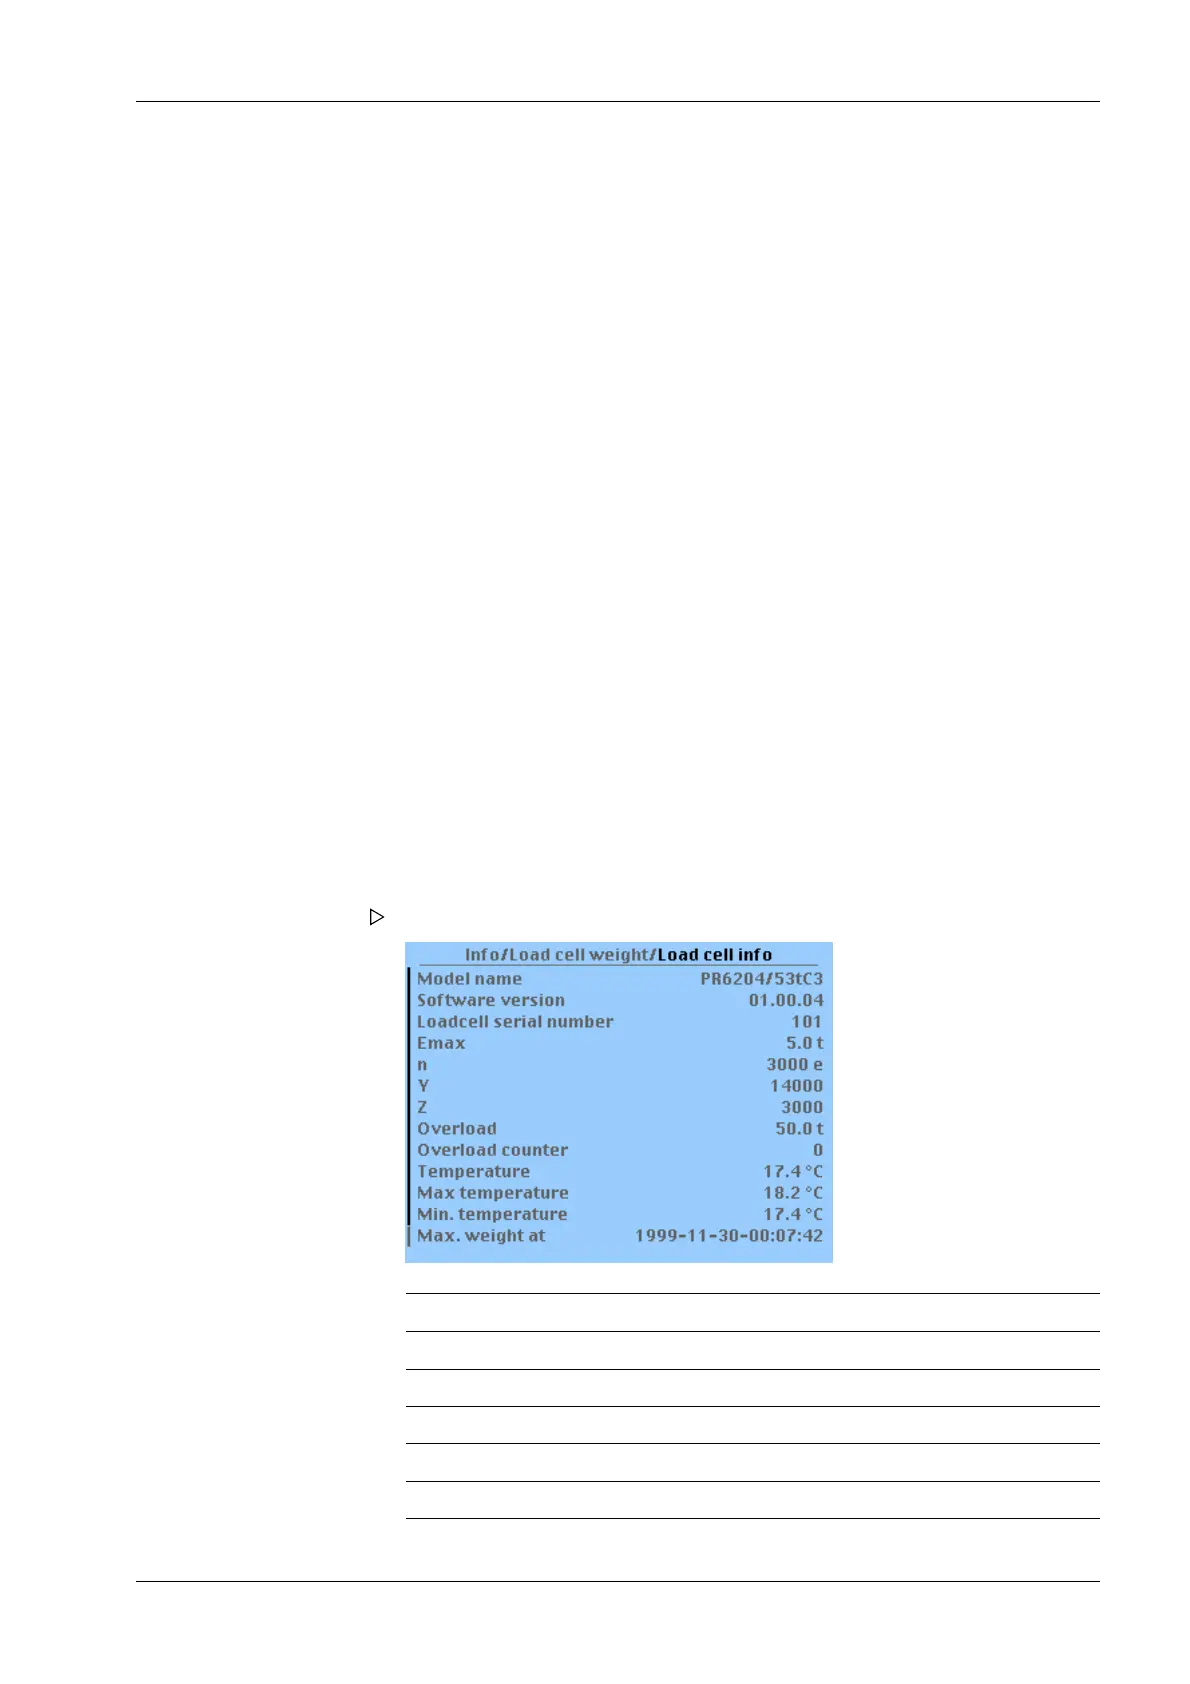
2. Select the desired load cell and press the [Info] softkey.
Display Description
Model name e.g.: PR6204/50tC3
Software version Software version of the load cell
Load cell serial number Serial number of the load cell
E
max
Maximum capacity
n Max. resolution
The load cell data is displayed:
7 Commissioning X3 Process Indicator PR 5410
EN-245 Minebea Intec