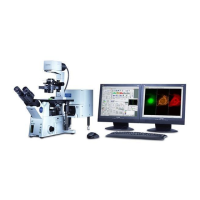
APPLIED OPERATIONS/Image Processing
IV.
OPERATION INSTRUCTIONS
IV .
2-251
Page
4 Regions Mode
Specifies the arbitrary region in [Histogram], and measures colocalization within the
region.
In addition, distribution level of brightness in draw pictorial figure is displayed on
[Display] panel. Color is the same as color of draw pictorial figure selected.
Fig. 2-102 [Colocalization Processor] Dialog Box
In case of Annotation Mode is [Regions]
<Rectangular> Button
Rectangular draw: On
graph, drag diagonally
from upper left to lower
right to draw
rectangular region.
<Circle> Button
Circle/Oval draw: Drag
diagonally rectangle
that circumscribes
region of the circle to be
drawn on the image.
<Poly region> Button
Polygon draw: Click
each peak to draw a
polygon. When the last
peak is clicked, the
peak clicked at first
time will be connected
with the last peak.
<Free Region> Button
Free draw: Specify
region by dragging on
image. Releasing the
mouse button at the
end of drag, end and
start positions are
connected.
[Annotation mode] Group
Box
When < Regions > option
button is selected, this dialog
box will appear.
[Annotation] Text Box
For details, refer to the explanation
that appears in next page.
[Histogram] Graph
You can draw a pictorial figure
on [Histogram], using graphic
button located at lower right side
of dialog box.
See 2-12 Entering Comment in
Image for methods to delete
graphic, to select plural numbers
of graphics and to change color
of graphic frame.
Original image
Colocalization
image
<Accept Annotation> button
It extracts brightness only of image
designated in rectangular on [Histogram]
graph and creates new [Display] panel
and displa
s the ima
e.
 Loading...