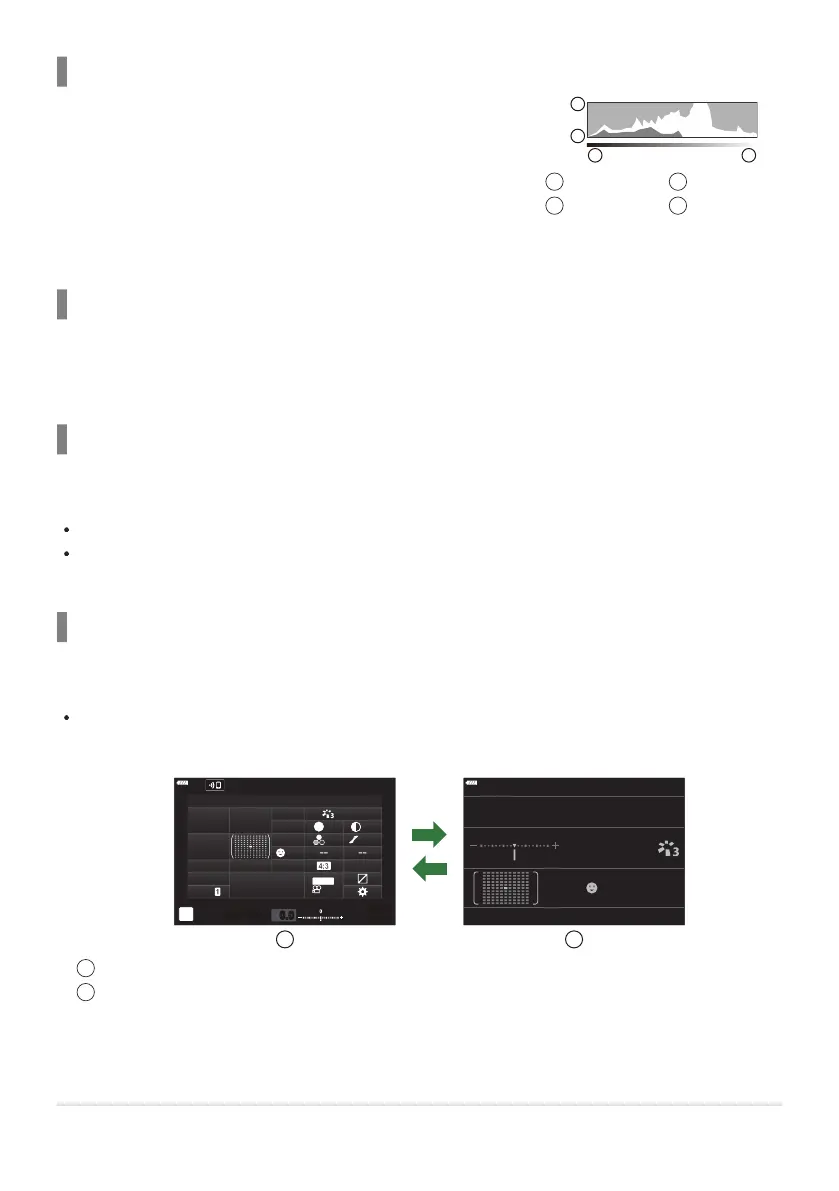
A histogram showing the distribution of brightness in the image is
displayed. The horizontal axis giv
es the brightness, the vertical axis
the number of pixels of each brightness in the image. Areas above
the upper limit at shooting are displayed in red, those below the
lower limit in blue, and those within the spot metering range in
green. You can choose the upper and lower limits. gCCustom
Menu k> [Histogram Settings] (P. 281)
More
Less
1
2
Dark
Bright
3
4
Histogram display
Highlights and Shadows
Highlights and shadows, defined accor
ding t
o the upper and lower limits for the histogram display,
are shown in red and blue. You can choose the upper and lower limits. gCCustom Menu k>
[Histogram Settings] (P. 281)
Level gauge display
The orientation of the camera is indicated. The “tilt” direction is indicated on the vertical bar and the
“horizon” direction on the horizontal bar.
The level gauge is intended as a guide only.
Calibrate the gauge if you find it is no longer truly plumb or level. gCCustom Menu r>
[Level Adjust] (P. 295)
Shooting Information
Shooting information can be viewed by pressing the INFO button when the super control panel
(P. 111) is displayed. Press the INFO button again to return to the super control panel.
Shooting information can be hidden using the [G/Info Settings]> [LV OFF-Info] option in
CCustom Menu i (P. 333).
WB
AUTO
0.0
1023
p
o
Y
F
S-AF Off
P
250 F5.6
ISO
AUTO
F
1
/
1600
sRGB
Natural
S
Normal
WB
Auto
ISO
Auto
±
0
A
±
0
±
0 ±
0
±
0
G
±
0
2022.10.16 12:30:00
250
1023
1:02:03
F5.6
p
o
0.0
S
-
AF
Off
30
p
30
p
4K
S-IS Auto
Y
F
#
±
0.0
#
M-IS
INFO
1 2
Super control panel
Shooting information
42
S
witching between displays
1
2