Common Analysis and Display Functions
R&S
®
FSVA3000/ R&S
®
FSV3000
413User Manual 1178.8520.02 ─ 01
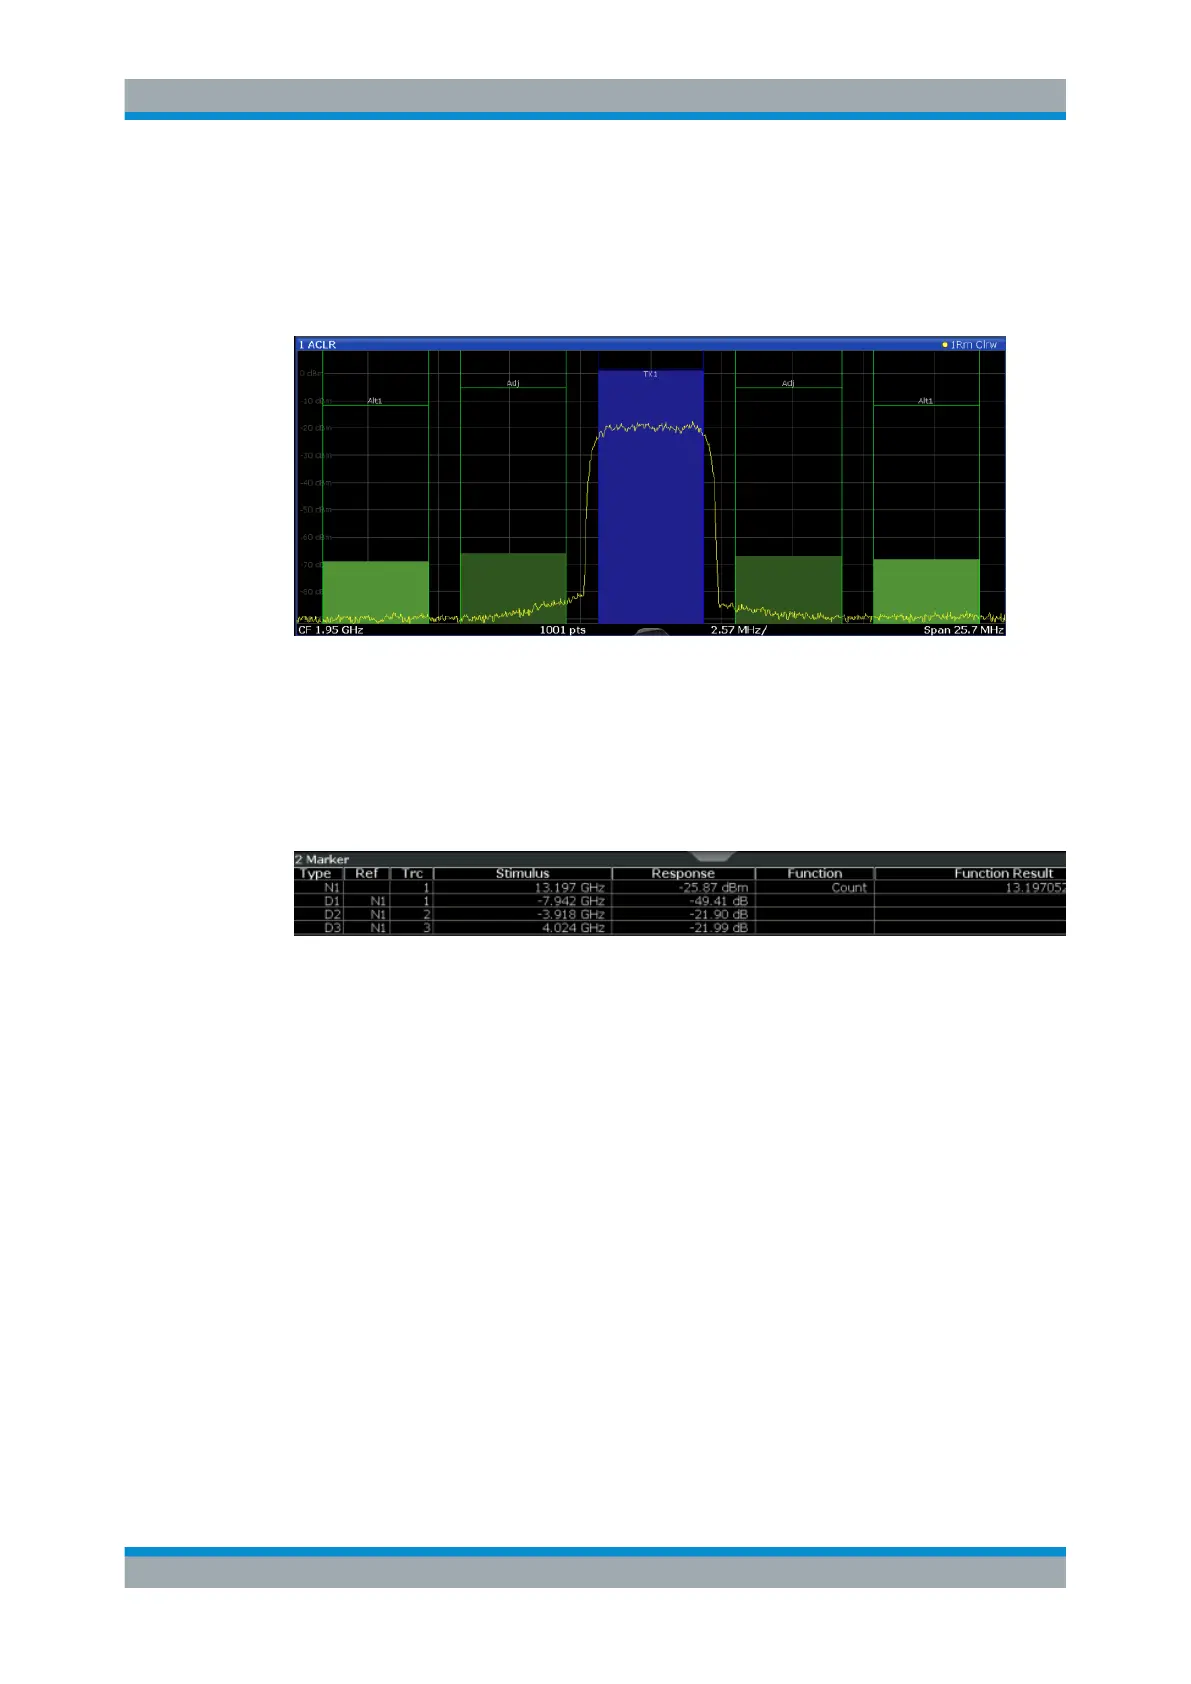
Diagram
Displays a basic level vs. frequency or level vs. time diagram of the measured data to
evaluate the results graphically. This is the default evaluation method. Which data is
displayed in the diagram depends on the "Trace" settings. Scaling for the y-axis can be
configured.
Remote command:
LAY:ADD? '1',RIGH, DIAG, see LAYout:ADD[:WINDow]? on page 876
Results:
TRACe<n>[:DATA] on page 975
Marker Table
Displays a table with the current marker values for the active markers.
Tip: To navigate within long marker tables, simply scroll through the entries with your
finger on the touchscreen.
Remote command:
LAY:ADD? '1',RIGH, MTAB, see LAYout:ADD[:WINDow]? on page 876
Results:
CALCulate<n>:MARKer<m>:X on page 987
CALCulate<n>:MARKer<m>:Y on page 1000
Marker Peak List
The marker peak list determines the frequencies and levels of peaks in the spectrum or
time domain. How many peaks are displayed can be defined, as well as the sort order.
In addition, the detected peaks can be indicated in the diagram. The peak list can also
be exported to a file for analysis in an external application.
You can define search and sort criteria to influence the results of the analysis.
Result Display Configuration

 Loading...


