Sysmex XP-300 8-5
Display and Output of Analysis Results
Revised April 2012
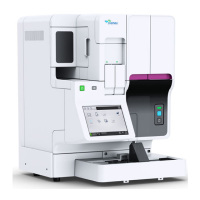
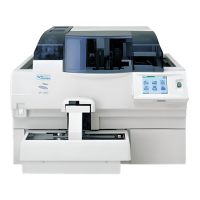
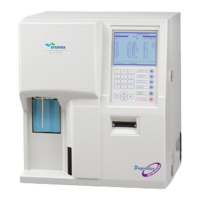
In 3 histograms (RBC, WBC, PLT), the volume distribution is shown
graphically. Flags are indicated by one of the following:
For details about sample flagging, see “8.3 Histogram error flags”.
WBC histogram: Displays a histogram for WBC.
RBC histogram: Displays a histogram for RBC.
PLT histogram: Displays a histogram for PLT.
Flag Explanation
(1) [WL] Relative frequency of WBC-LD has exceeded the range.
(2) [WU] Relative frequency of WBC-UD has exceeded the range.
(3) [T1] T1 discriminator position cannot be determined.
(4) [T2] T2 discriminator position cannot be determined.
(5) [F1] Relative frequency of T1 has exceeded the range.
(6) [F2] Relative frequency of T1 or T2 has exceeded the range.
(7) [F3] Relative frequency of T2 has exceeded the range.
(8) [RL] Relative frequency of RBC-LD has exceeded the range.
(9) [RU] Relative frequency of RBC-UD has exceeded the range.
(10) [DW] Distribution width cannot be calculated.
(11) [MP] There are multiple peaks.
(12) [PL] Relative frequency of PLT-LD has exceeded the range.
(13) [PU] Relative frequency of PLT-UD has exceeded the range.
(14) [AG] The particle count equal to or less than WBC-LD has
exceeded the range.