USTER
®
HVI SPECTRUM
Instruction Manual
3.5 Graphs
As stated previously, the
HVI SPECTRUM
is designed to be flexible with
the type and format of the test data that are presented. Therefore, in
addition to providing a means of creating reports, the
HVI SPECTRUM
also provides a means to create graphs.
The REPORTS option, located on the
HVI
SPECTRUM
MAIN MENU,
accesses the REPORTS MENU screen. Menu options give access to graph
screens that are used to design, delete, and modify graphs.
3.6 Creating a New Graph
1. To access the GRAPH DESIGN screen, first select the GRAPHS menu
item from the REPORTS MENU screen and then select the DESIGN
item.
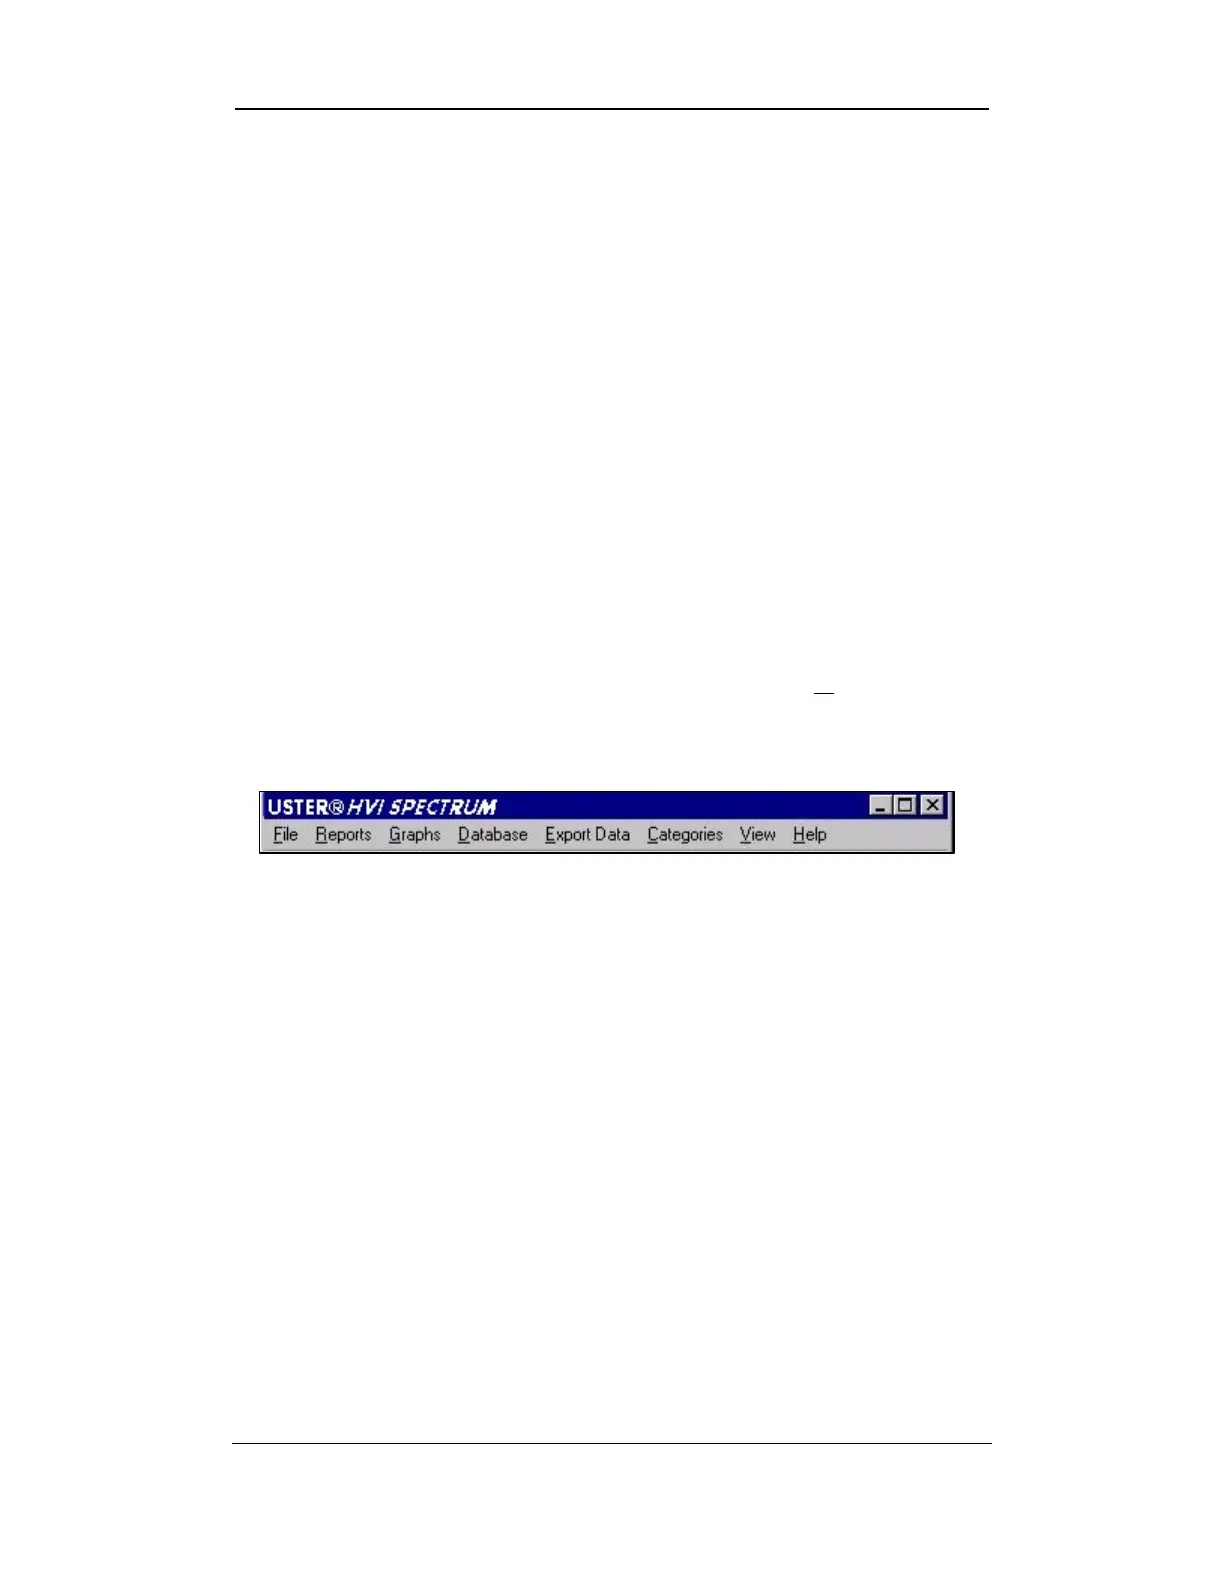
Figure 8-9: Reports Screen Menu options
2. The
HVI SPECTRUM
offers two graphs for charting fiber-testing
data. They are the Histogram and the Color Chart.
o A Histogram is a bar chart that is broken down by categories
for a chosen property on the x-axis and the bale count on the y-
axis.
o A Color Chart shows the Rd versus the +b in a scatter plot
that corresponds with the operator-configured color chart.
3. Begin to create a new graph by selecting the NEW button on the
G
RAPH DESIGN screen.
4. Type the name of the new graph in the Graph Name field.
Press TAB or ENTER to move the cursor to the next field or
position it in the next field using the touch pad.
Uster Technologies, Inc. Chapter 8
Reports • Page 8-13