USTER
®
HVI SPECTRUM
Instruction Manual
6. The information that appears on the report is determined by the
report properties chosen. A list containing all the available fiber
properties is displayed in a window.
o To select the report properties, simply highlight the property in
the left-hand side column in the window and choose the SELECT
button. The item will be displayed in the right side column.
o Repeat this process until all properties that are to be included in
the report are listed in the right side column. If you want all of
the listed properties to appear in your report, you can select
them all at the same time by choosing the SELECT ALL button.
Likewise, you can de-select items in the right-hand list by
choosing the REMOVE or REMOVE ALL buttons.
7. Once you have selected the properties, you can further define the
report as described below.
Reports can be displayed or printed in three different ways:
Value — The test values from the
HVI SPECTRUM
are reported for
samples in each identifier for the properties selected.
Categories — The test values are assigned to a category according to
the category definitions. The assigned category is printed on the report.
Values and Categories — Both the test values and the assigned
category number are displayed/printed.
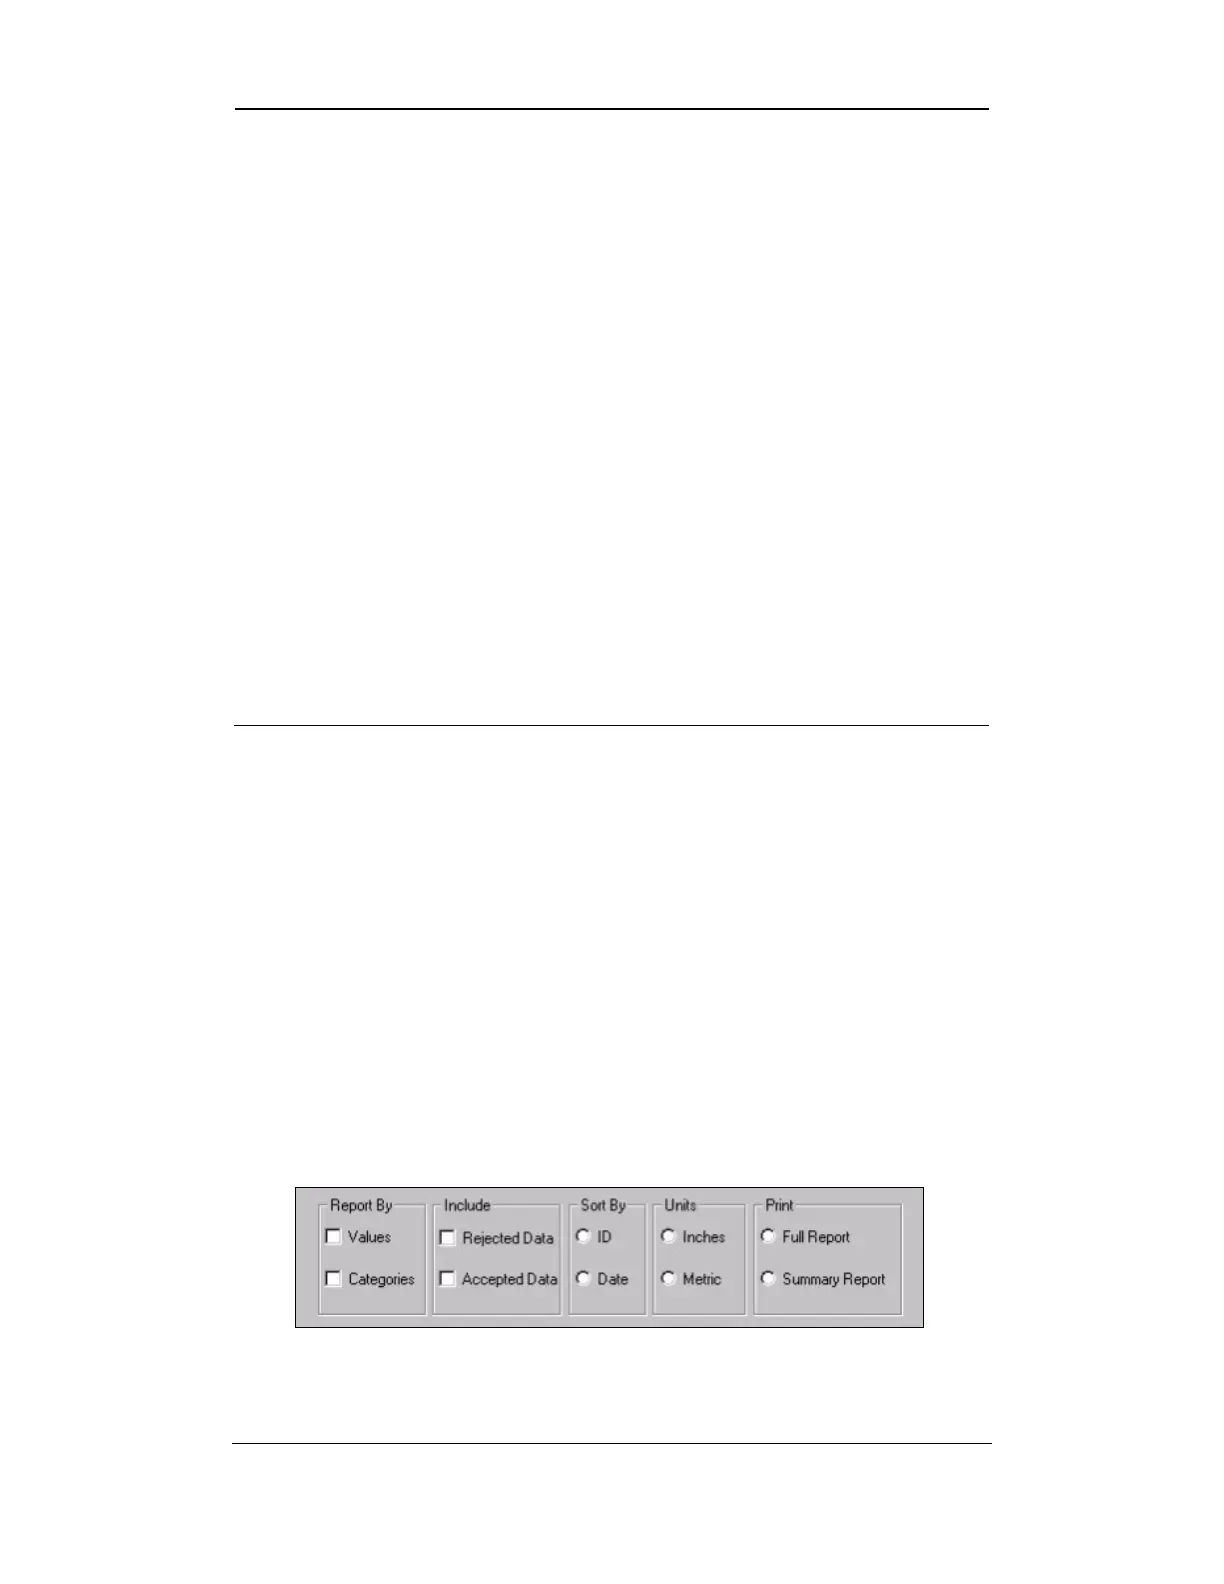
These options are found on the lower part of the R
EPORT DESIGN screen
(Refer to Figure 8-6 or to the figure below which shows the lower section
of the screen).
Figure 8-7: Report Design Screen – Lower Section
Uster Technologies, Inc. Chapter 8
Reports • Page 8-9