USTER
®
HVI SPECTRUM
Instruction Manual
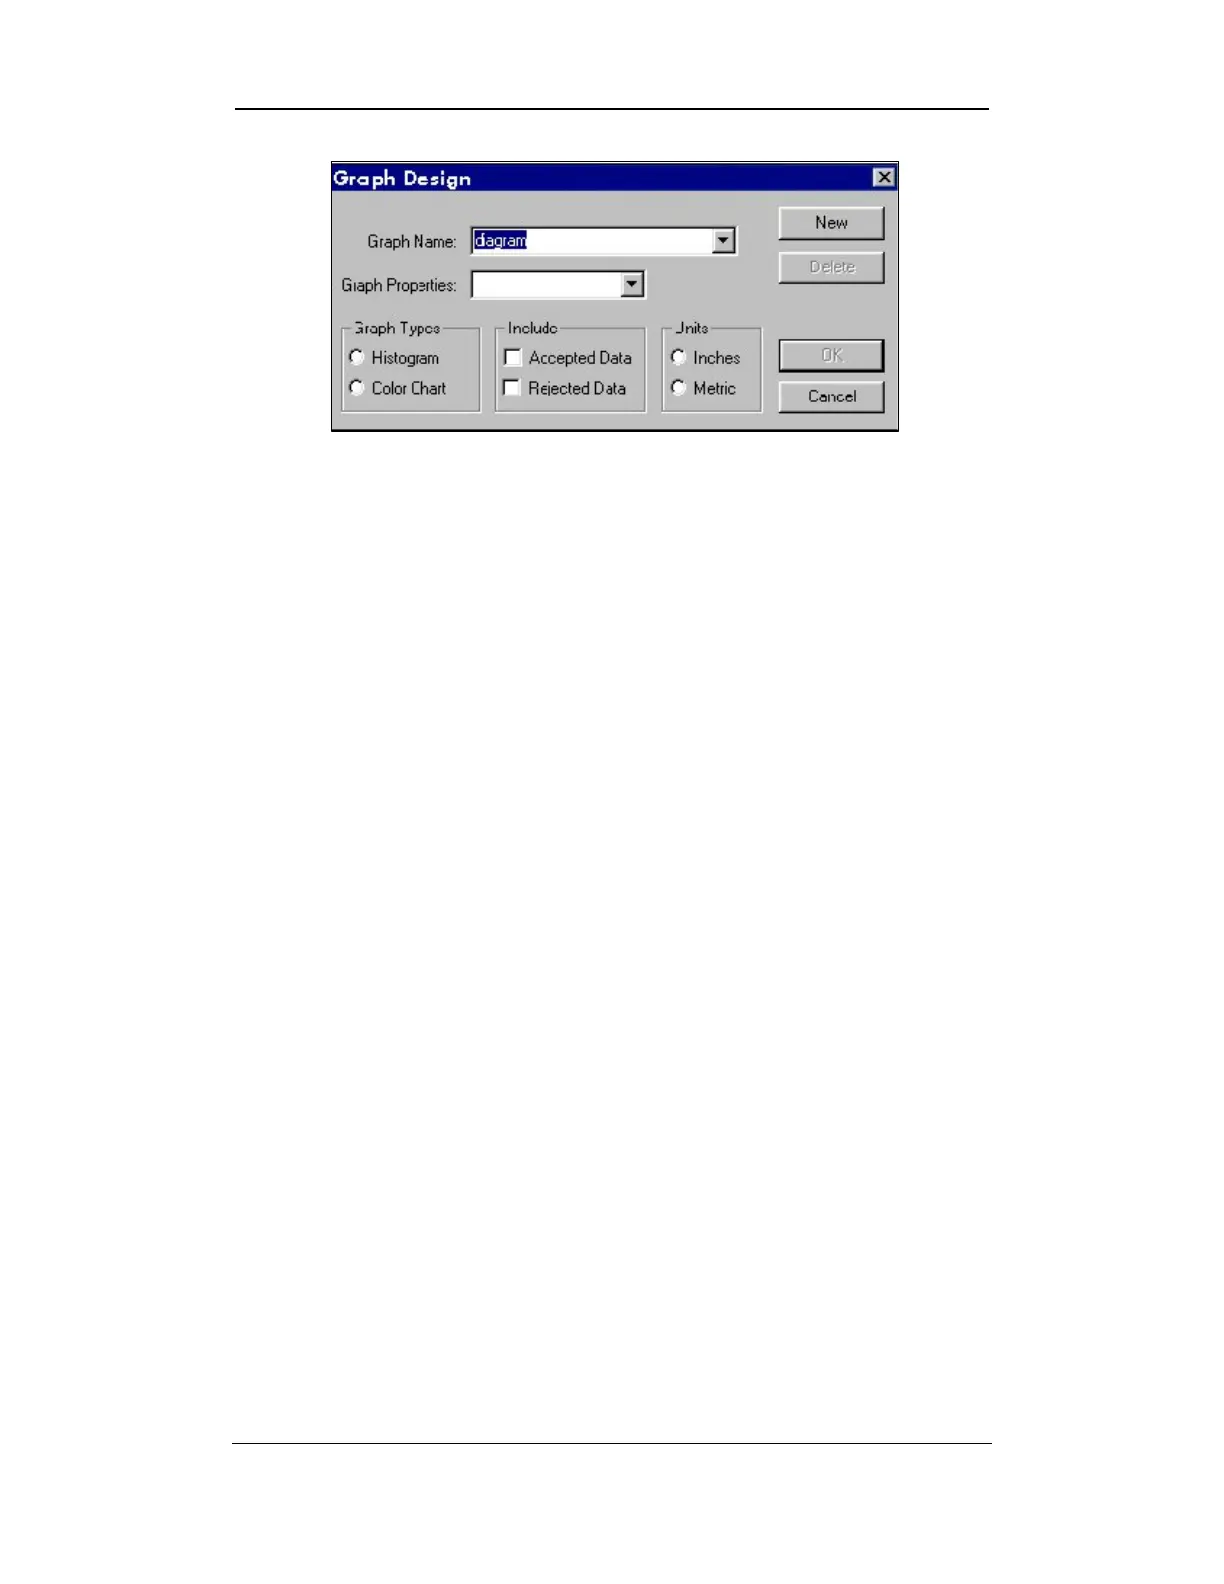
Figure 8-10: Graph Design Screen
Note:
The graph name will also be the title of the graph.
5. If you are creating a Histogram, select the appropriate property
from the pull-down list in the Graph Properties field. (This field
is shaded out when creating a color chart because it doesn’t
apply.)
6. Select the type of graph you are creating by clicking in the circle
for either Histogram or Color Chart in the Graph Types
area.
7. If you are creating a histogram or a color chart, select to include
Accepted Data, Rejected Data, or both by placing a check
mark in the appropriate box/boxes.
8. Choose to display the data in either Inches or Metric in the
Units
area following the same manner as above.
9. Once you have selected the appropriate type of graph and include
all information, select the OK button to save the new graph.
Uster Technologies, Inc. Chapter 8
Reports • Page 8-14