USTER
®
HVI SPECTRUM
Instruction Manual
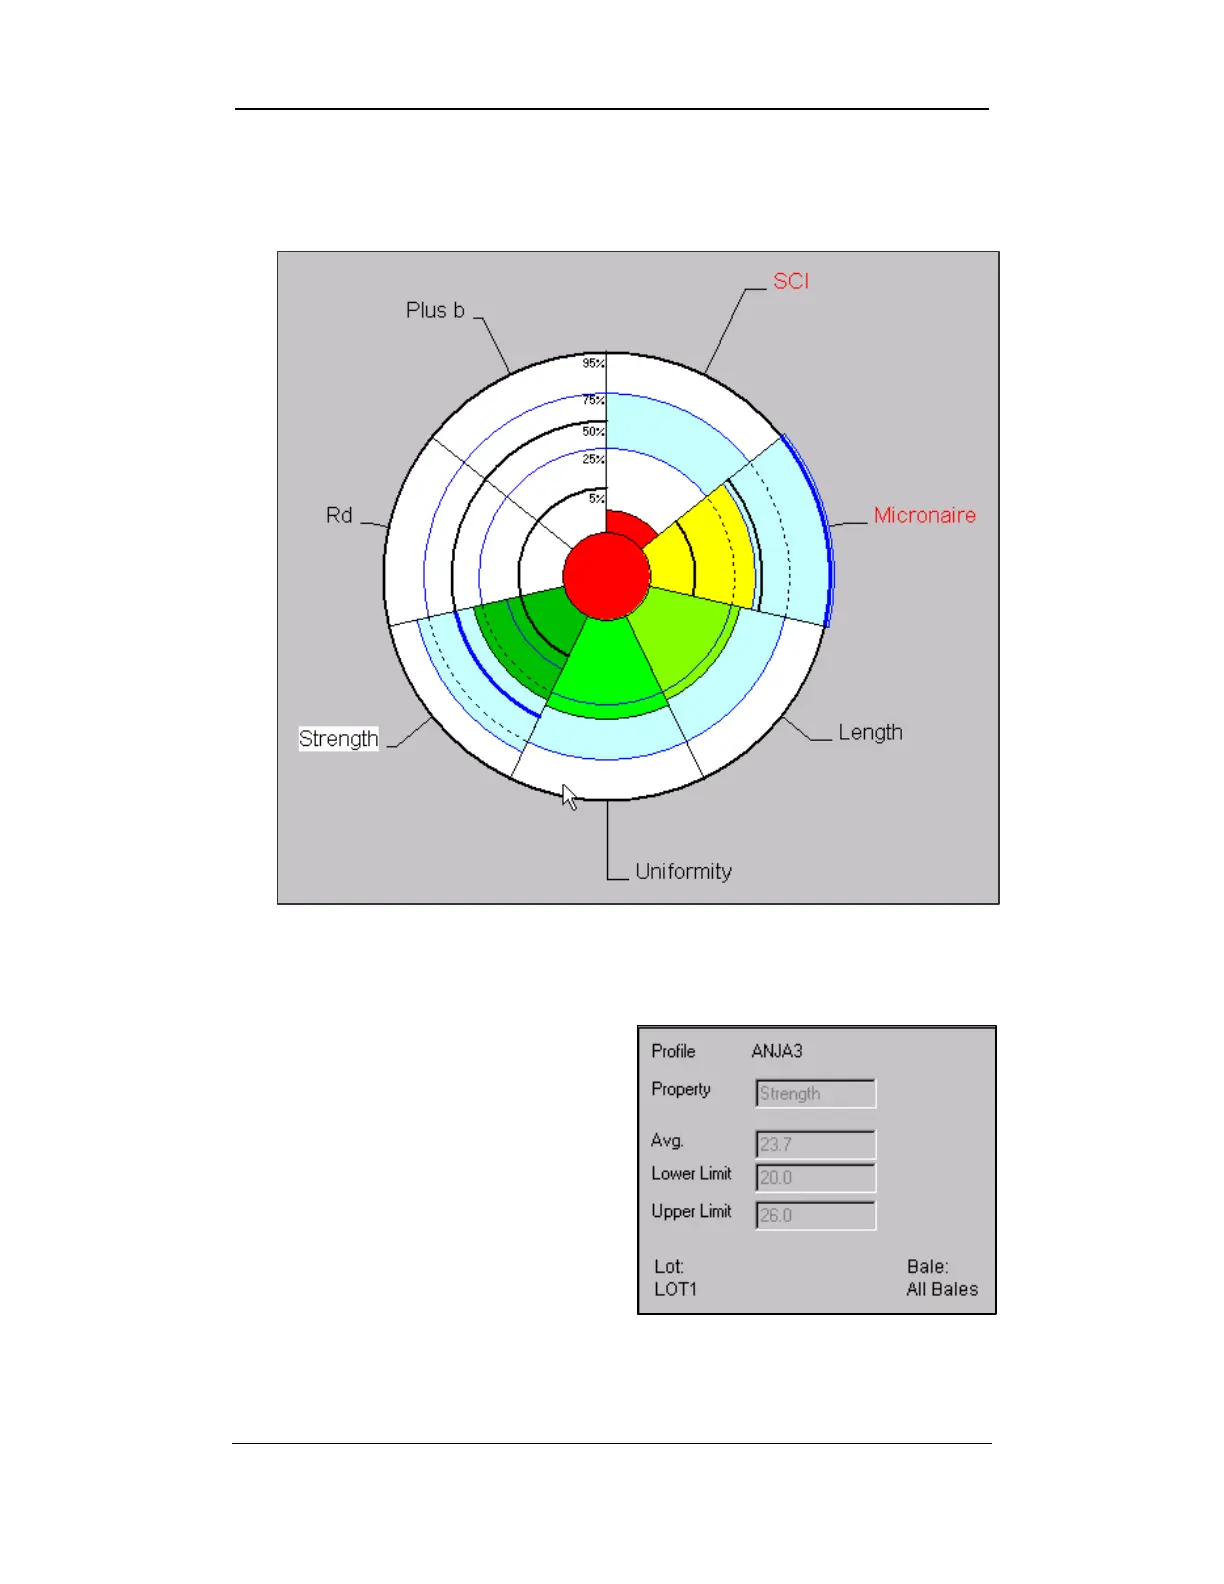
• For example, the color GREEN indicates that the value is within
the set value limits and RED indicates that the value is outside
those limits.
Figure 11-1: Graph Example 1
6. Print the graph by choosing P
RINT from the FILE menu option.
7. The screen containing the
graph will also show the
screen shown in figure 11-2.
8. This graphic displays the
values of the profile when the
operator clicks on one of the
graphical pie’s slices.
Figure 11-2: Graph Example 2
Uster Technologies, Inc. Chapter 11
USTER® QualiProfile • Page 11-2