Rockwell Automation Publication 5069-UM002A-EN-P - January 2019 265
Troubleshoot the Controller Chapter 11
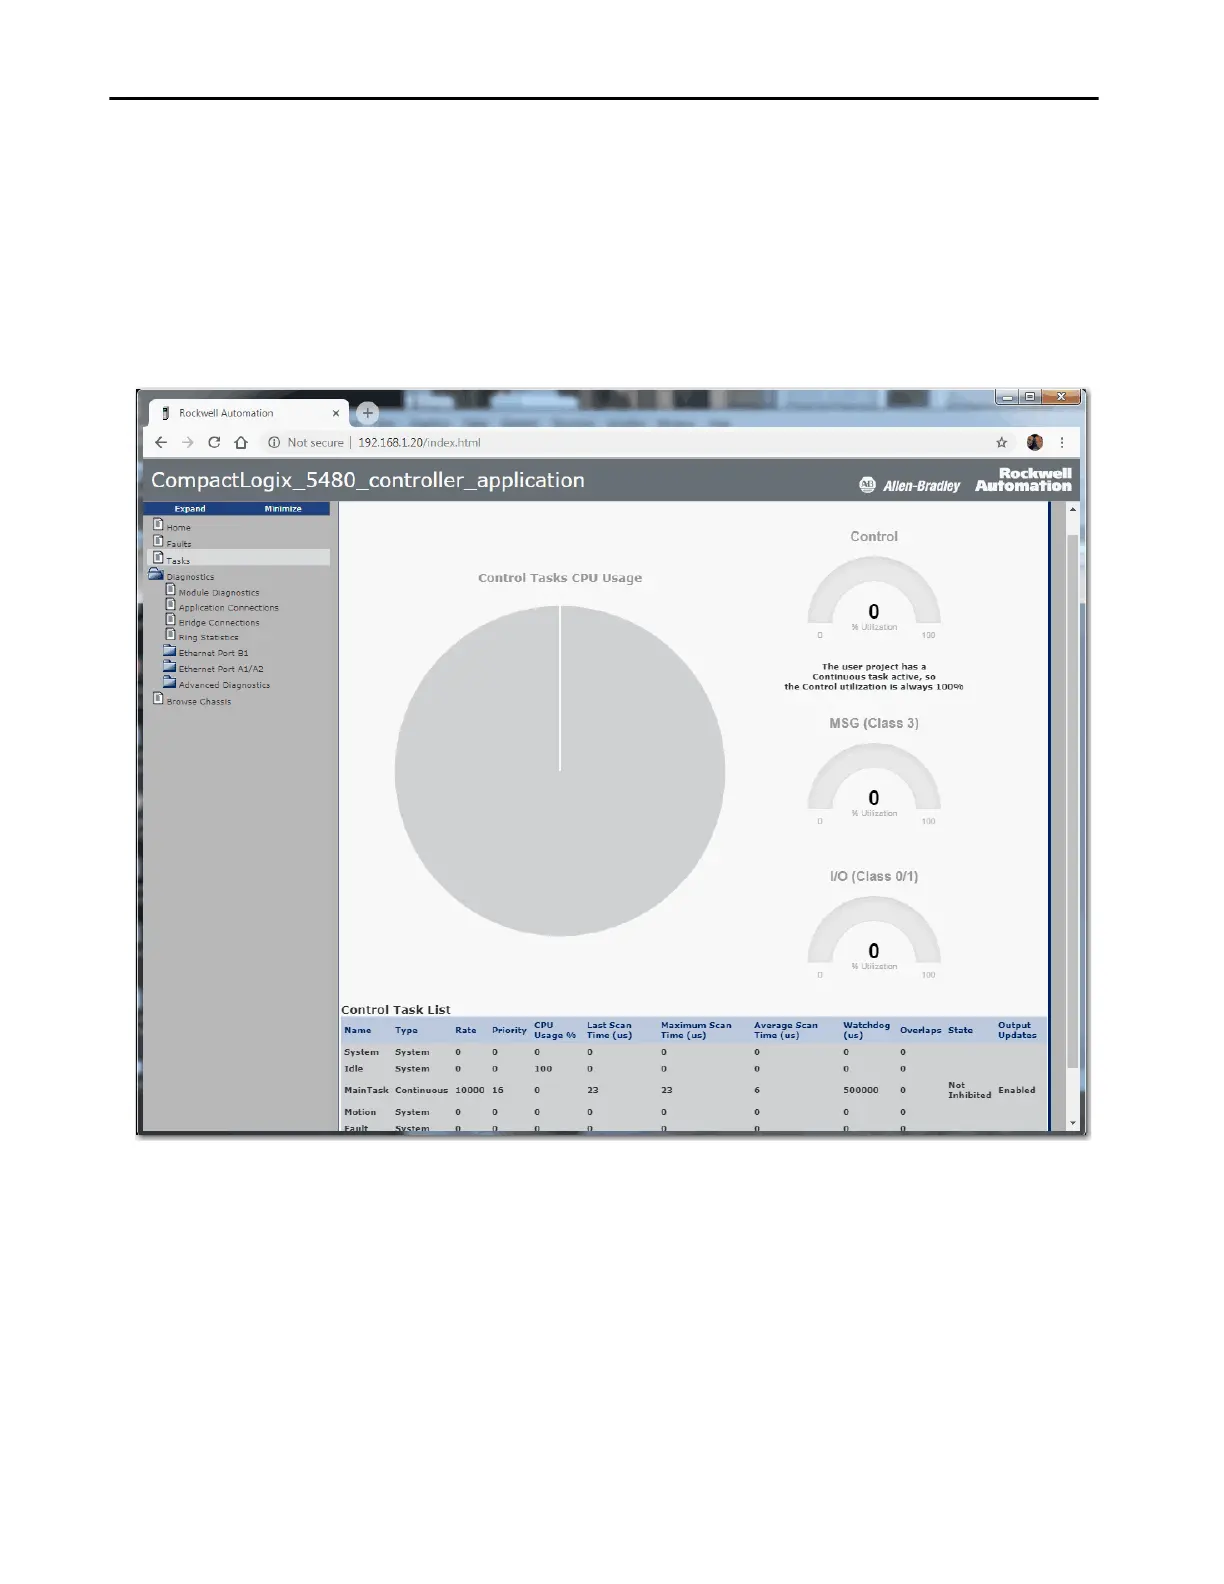
Tasks Webpage
On the Tasks webpage, the pie chart shows the percentage of the control core
CPU consumed by the tasks that are on that core. The gauges show the CPU
utilization of the control and communications cores.
The table shows the tasks that are running on the Control core (all system tasks
are summarized as one task).
 Loading...