Creating Plots and Histograms
3. Apply a filter, if needed.
Note: You can apply a filter only if you have set filters (or regions) on plots that you previously
created in the current experiment.
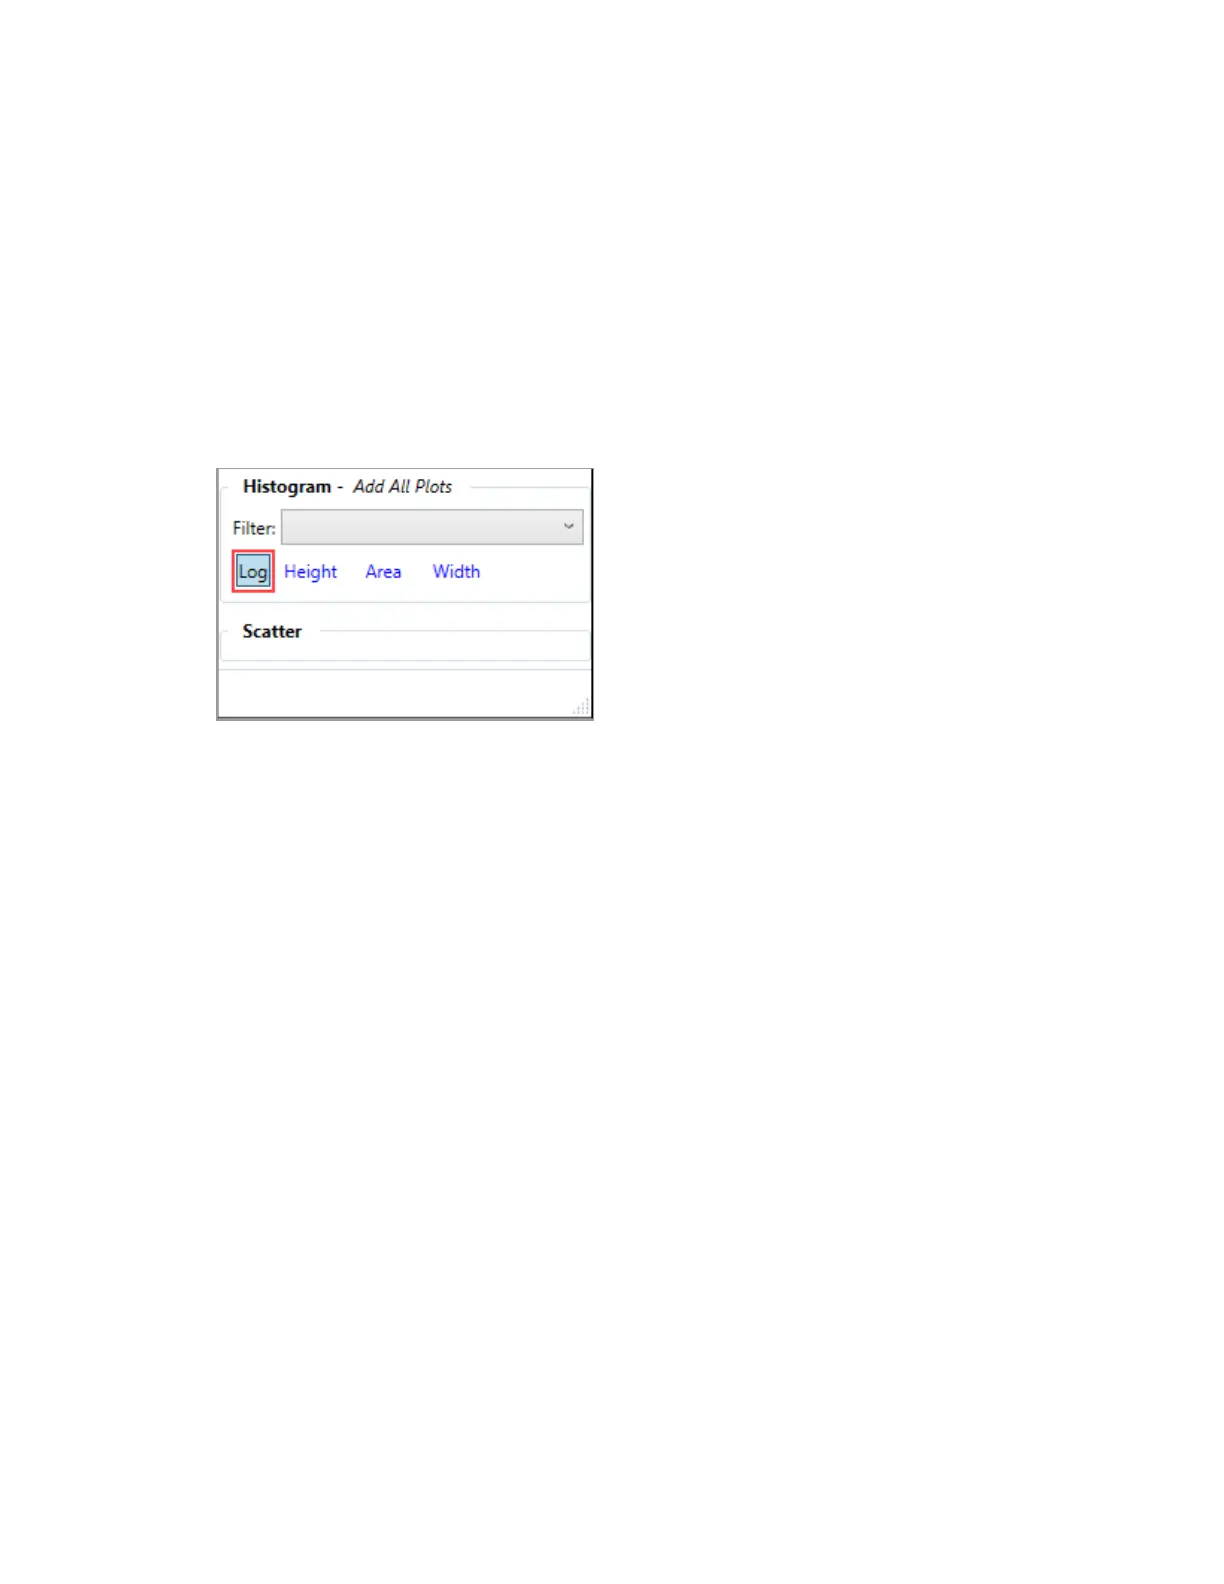
4. Specify linear or log scale.
Note: The default scale is linear although Log appears to be selected. To specify log scale,
click Log until the box appears blue. For example:
User Guide | 215


 To Next Page