Using Plot and Histogram Tools
Managing Plot Statistics
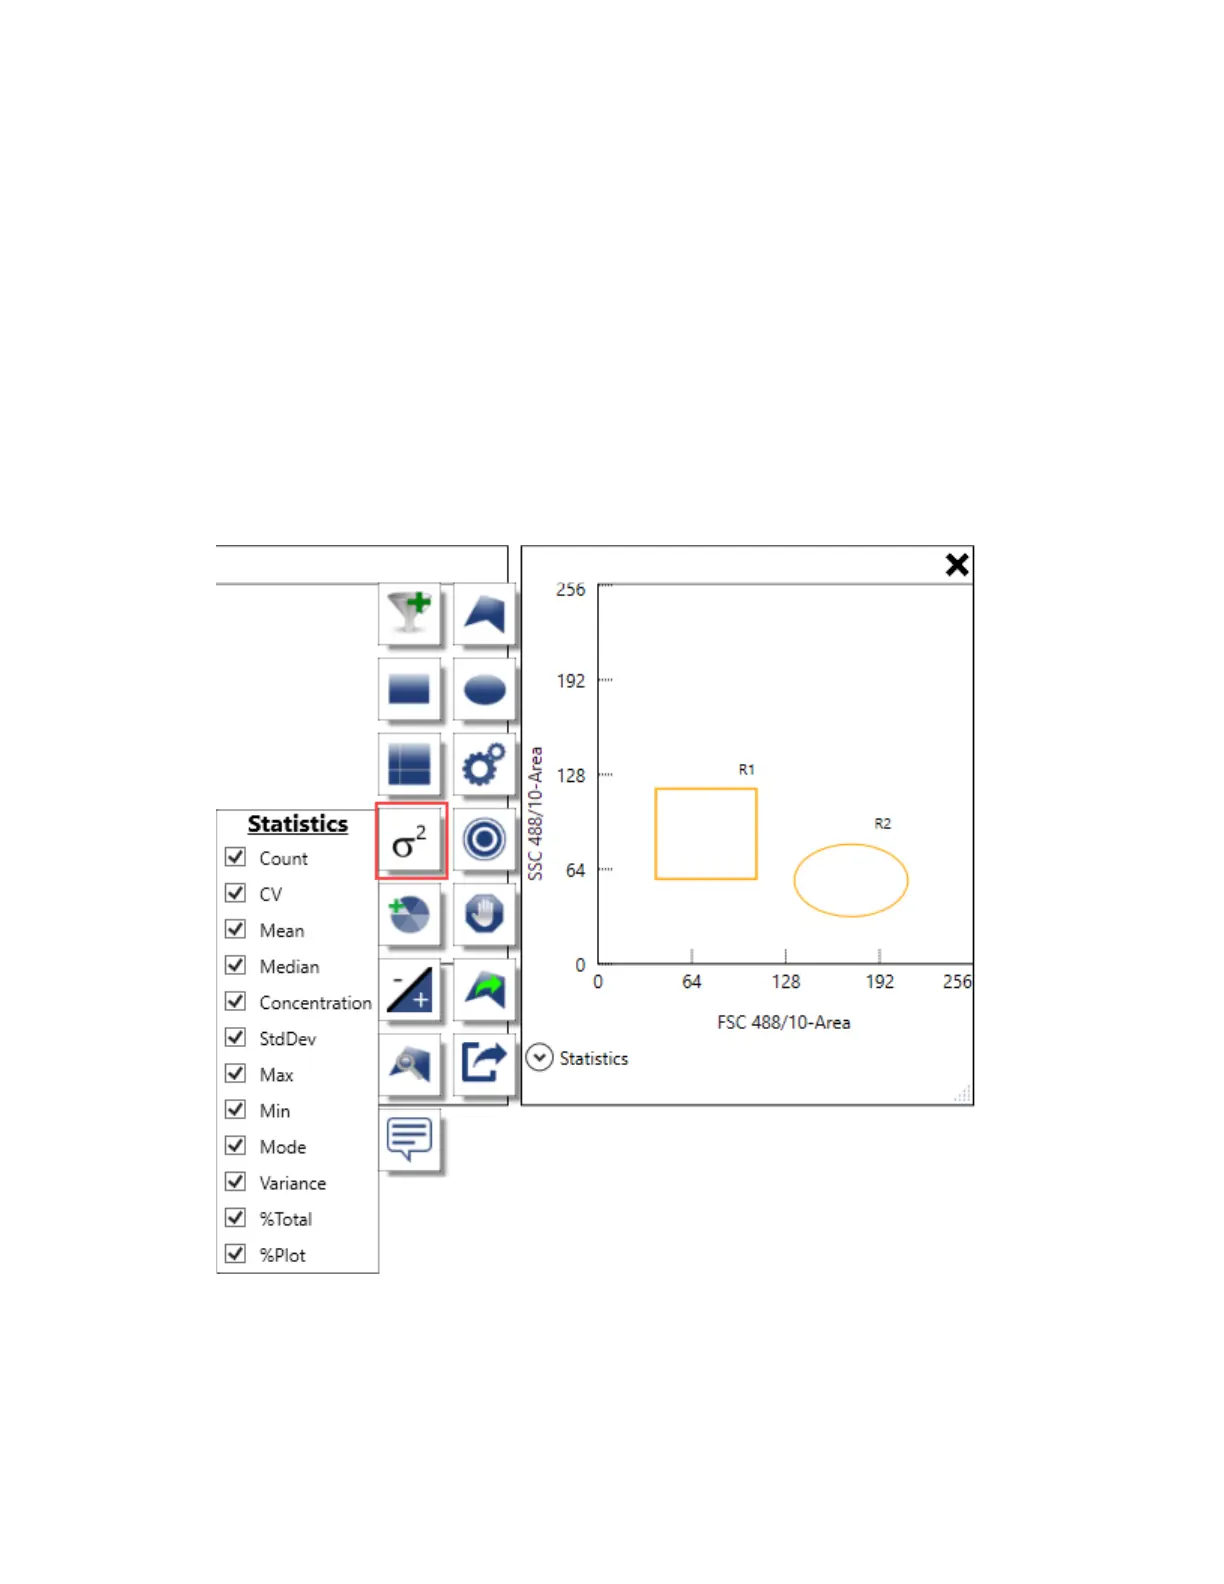
You can select specific statistics to view in each plot or histogram.
To manage plot statistics
1. Point to a plot or histogram for which you want to manage statistics.
The plot and histogram toolbar appears.
2. Click Manage Statistics.
3. In the Statistics dialog box, select the items you want to view and clear the items you want to hide.
4. Point outside the plot to save your changes.
User Guide | 221


 To Next Page