Analyzing Data
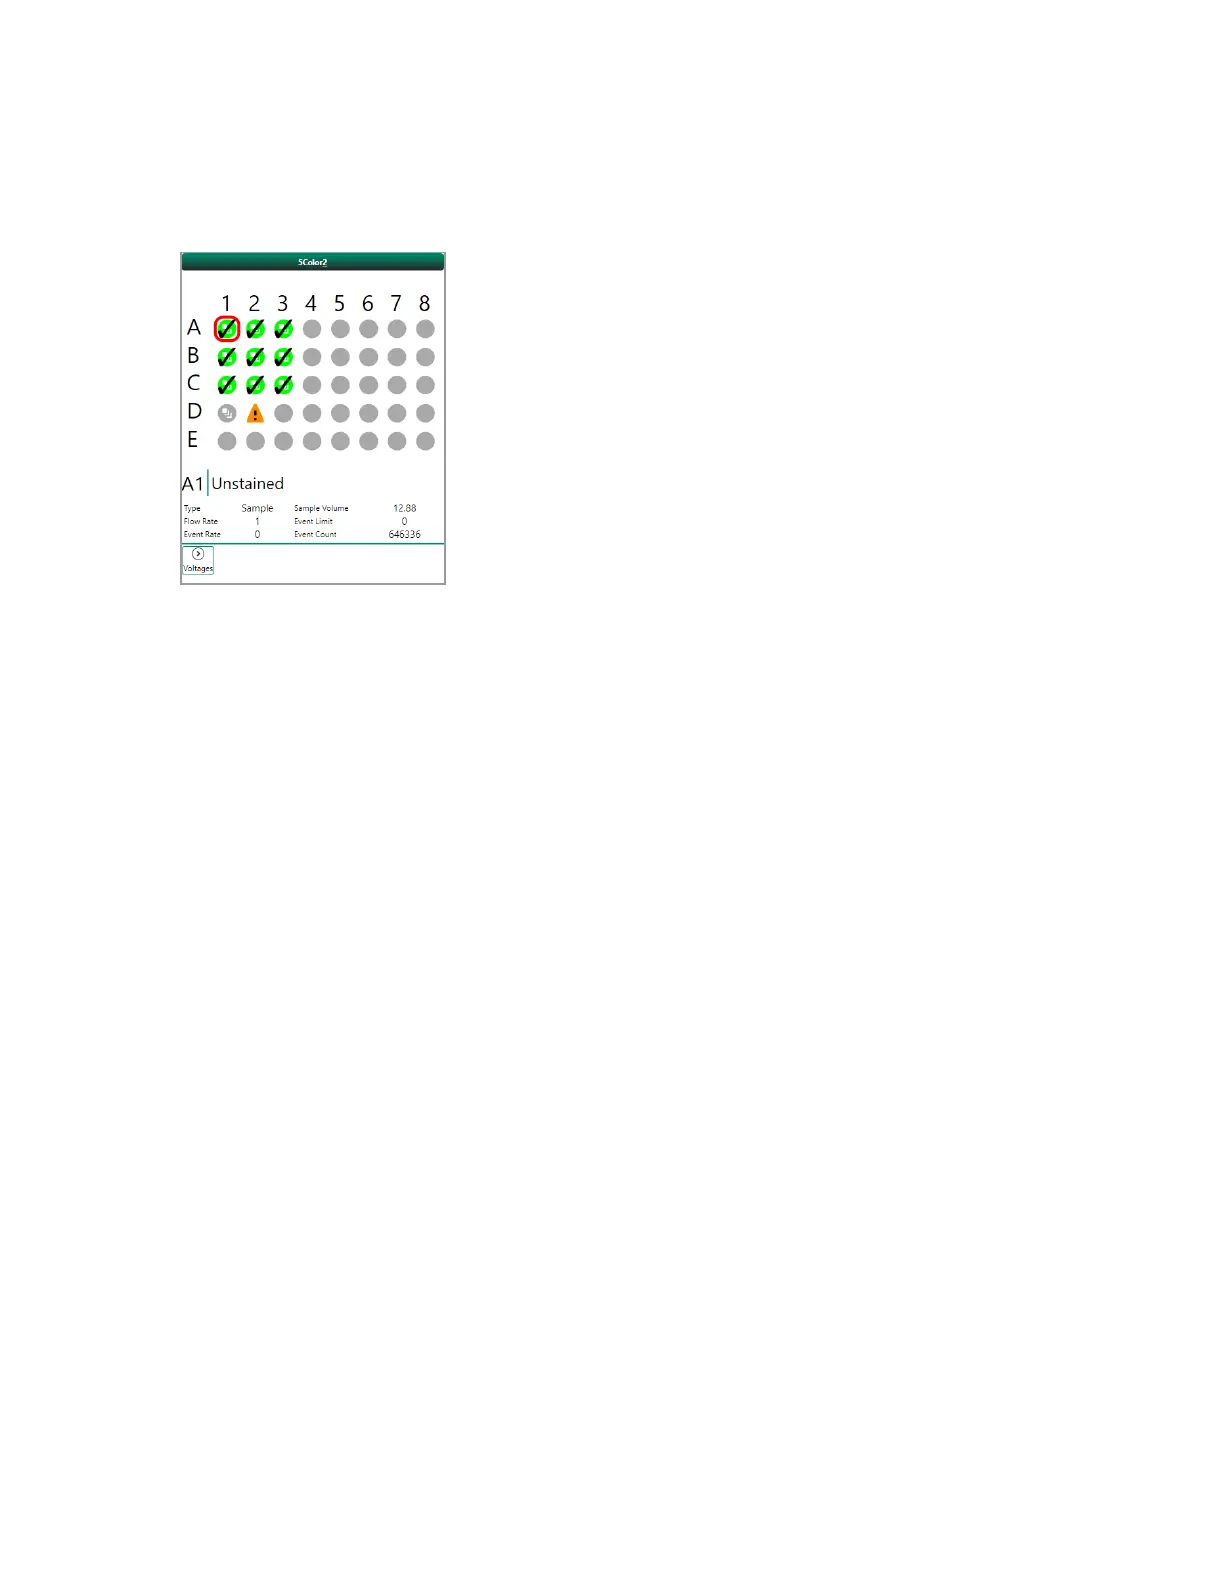
Below the plate map, the following information about the selected position is displayed:
n Sample position
n Sample name
n Sample type (Sample, Compensation/Control, Wash, or Reagent)
n Target Flow Rate (μl/sec) or Target Event Rate (events/sec)
n Sample Volume (μl)
n Event Limit
n Event Count
Below this area, you can click the Voltages arrow to display or hide PMT voltage conditions at the time
of data acquisition.
Tip: If you want to add plot annotations or otherwise modify plots for multiple sample positions for
presentation purposes, make these modifications in the Analysis tab, then use the Batch Print
feature of the Publish tab to save the report to PDF or print it. For more information, see Printing a
Report for All Positions on page 312.
Working with Compensation in the Analysis Tab
In the Analysis tab, you can either view the compensation matrix and edit it manually, or you can apply
automatic compensation.
For detailed information on applying compensation automatically or manually, see Chapter 9,
Applying Fluorescence Compensation. For an example experiment utilizing compensation, see
Appendix B, Example 9-Color Immunophenotyping Experiment.
User Guide | 307


 To Next Page