Using Plot and Histogram Tools
Adding Regions to Density Plots and Time Plots
The steps to follow when adding regions depend on the region type.
To display density plot and time plot region tools
u Point to the plot.
The plot and histogram toolbar appears.
To add a rectangle region to a plot
1. In the plot and histogram toolbar, click Add Rectangle Region.
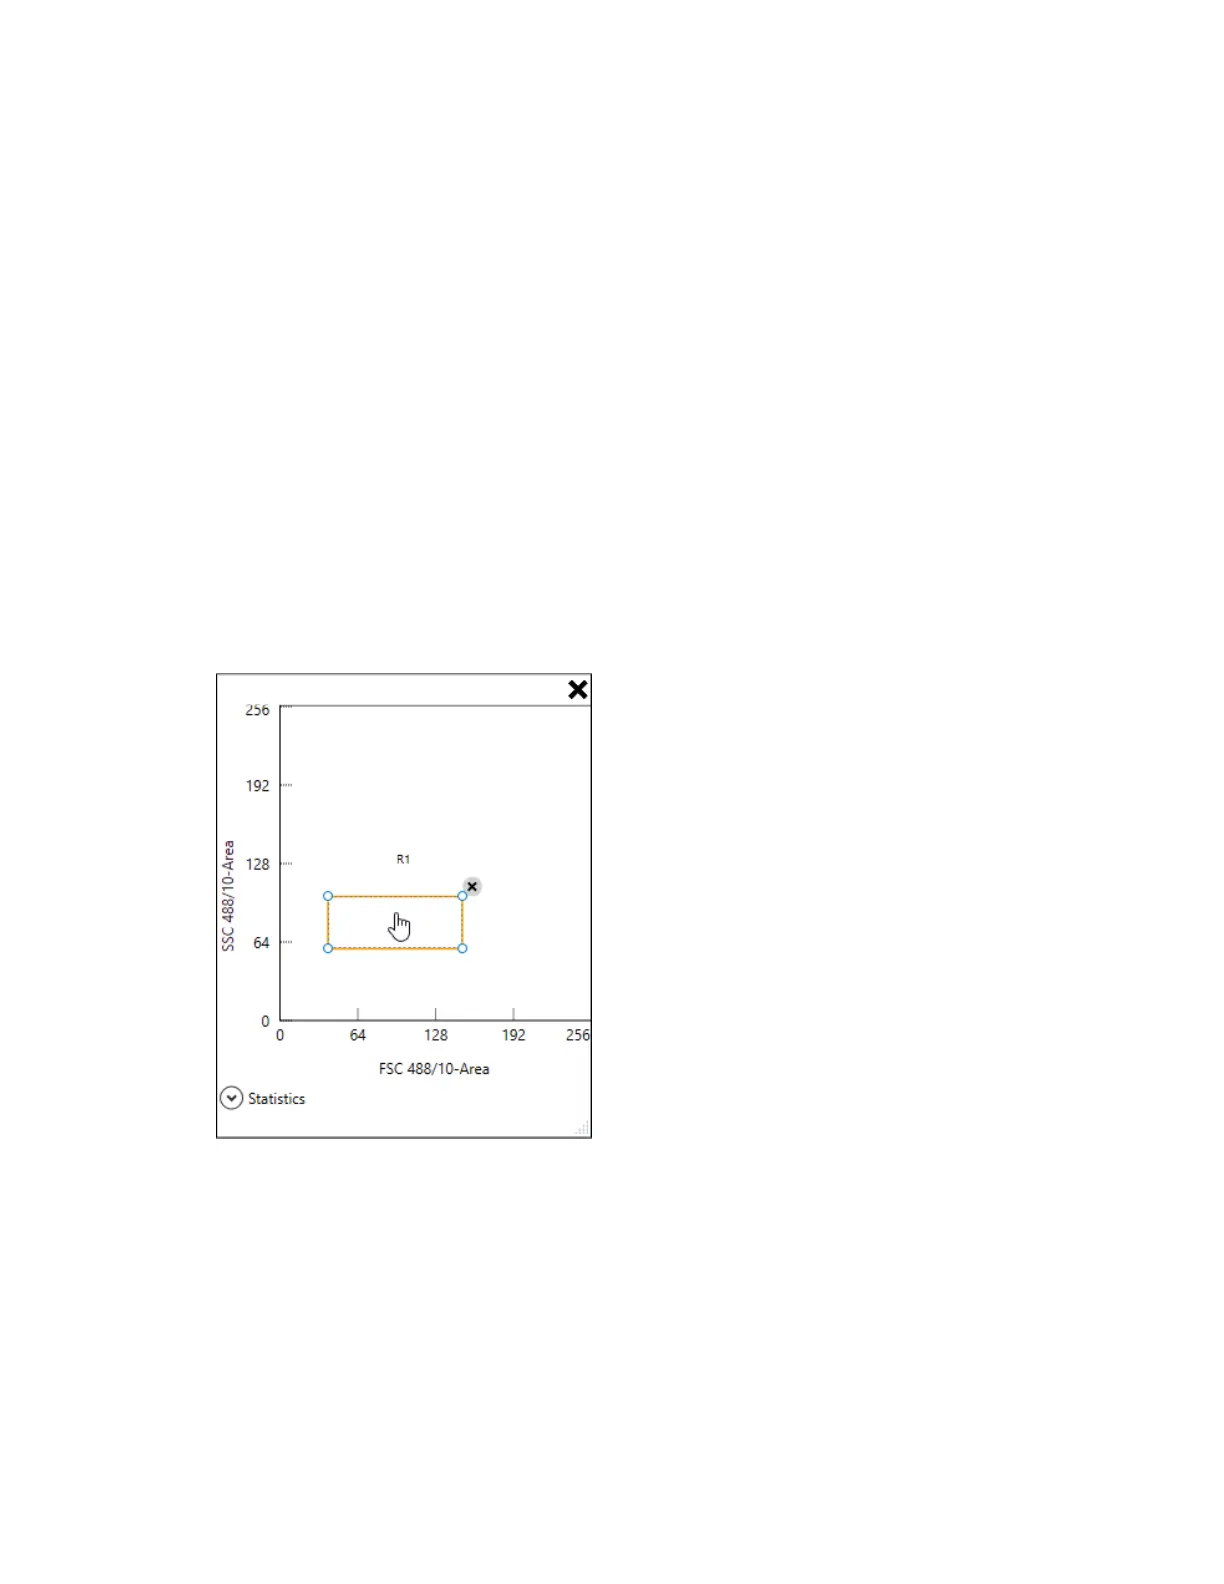
A rectangle is added to the plot.
2. To move the rectangle to another part of the plot, point inside the region.
When the pointer changes to a hand, use it to drag the rectangle.
3. To resize the rectangle, point to its outline.
User Guide | 225


 To Next Page