Creating Plots and Histograms
Creating Plots and Histograms
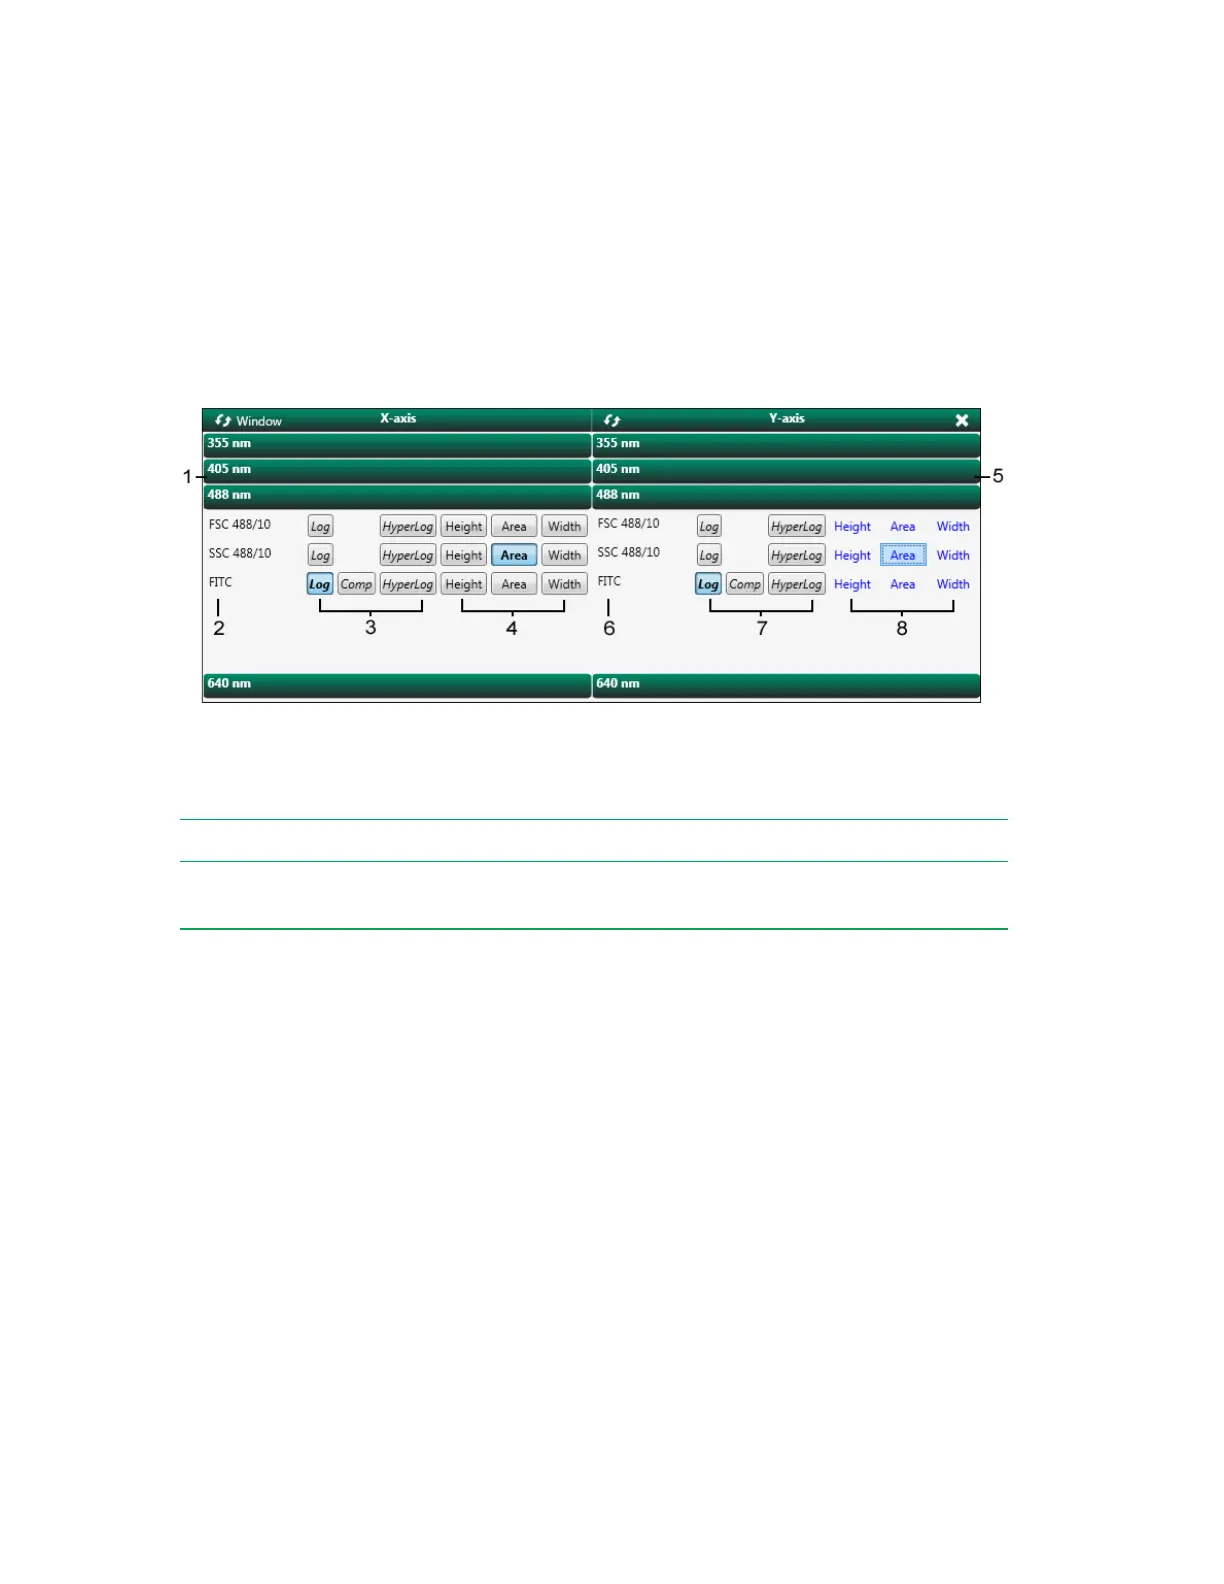
To visualize data in the workspace, you can add density plots, time plots, and histograms manually, or
you can let Everest Software automatically create plots. The next figure shows the controls for
configuring a density plot.
Legend
1
X-axis laser selection
5
Y-axis laser selection
2
X-axis parameters
6
Y-axis parameters
3
X-axis scaling and compensated data
display
7
Y-axis scaling and compensated data
display
4
X-axis pulse measurement
8
Y-axis pulse measurement
The parameters that appear in the plot builder reflect those that were activated in the Experiment
Builder Fluorophores screen. You can specify linear, log, or hyperlog scaling for each axis; specify the
pulse measurement (area, height, or width); and enable display of compensated data as needed.
For more information, see Creating Density Plots on page 211, Creating Histograms on page 212, and
Creating Time Plots on page 213.
Plots Created by the Compensation Template
If you turned on the Negative Control option in the Template area of the Samples screen, Everest
Software automatically creates the necessary plots. The negative control position is associated with a
forward scatter-by-side scatter plot and a plot for each fluorophore; these plots can assist you in
setting voltages.
User Guide | 209